What is Use The Agent
Use The Agent is a white-labeled operating system for insurance agencies. It brings activity, sales, commissions, forecasting, goals and coaching into one place — and adds an AI Chief of Staff, The Agent, that reads your whole book of business and tells your team where to grow.
Who this is for
These docs cover every page, button, form and setting in the app. They're written for two audiences:
- Agency owners & managers — who set up the workspace, manage the team, configure commissions, and watch agency-wide performance.
- Producers & CSRs — who log activity, track their own goals and commission, and ask The Agent for help.
How the app is organized
Everything lives behind a single login at app.usetheagent.com. The left sidebar groups pages into seven areas:
| Area | What's inside |
|---|---|
| Overview | Dashboard, Scorecard |
| Performance | Team, Employees, Leaderboard, Goals & KPIs, Ask The Agent |
| Strategy & Training | Strategic Growth plan, Resource Library |
| Data | Data Import |
| Agency Tools | Activity Tracker, Word Tracks, Calendar |
| Analytics | Sales Ledger, Book of Business, Sales Forecast, Close Ratios |
| System | Settings, Platform Settings |
What you see depends on your role. Owner / Manager accounts see the whole agency. Producer accounts are focused on their own numbers and are sent straight to their Scorecard. Role differences are called out on each page.
Getting started in three moves
- Create your account and pick your carrier — see Create your account.
- Complete the strategy interview so The Agent can build your KPIs and 12-month plan — see Onboarding.
- Import your book of clients and policy sales so dashboards fill with real data — see Import clients.
Create your account
New agencies sign up through a short wizard at app.usetheagent.com/signup. It walks you from your login details through to importing data and a strategy interview — five steps in all.
The five steps
- Your Account — first name, last name, email and a password. A live strength meter rates your password Weak, Fair or Strong as you type.
- Your Agency — your agency name and carrier. State Farm is available today; other carriers show as Coming Soon.
- Plan & Setup — confirms your plan and lets you enter an optional promo / coupon code.
- Import Data — bring in your clients and policy sales now, or skip and do it later from Imports.
- Strategy Interview — the AI interview that builds your KPIs and plan (covered under Onboarding).
Step 1 — Account fields
| Field | Required | Notes |
|---|---|---|
| First name | Yes | — |
| Last name | Yes | — |
| Email address | Yes | Must be a valid email; becomes your login. |
| Password | Yes | At least 8 characters. Strength meter rewards 12+ chars, mixed case, a digit and a symbol. |
Step 2 — Agency fields
| Field | Required | Notes |
|---|---|---|
| Agency name | Yes | Appears throughout your white-labeled workspace. |
| Carrier / Provider | Yes | Select State Farm. Your workspace is branded to match. |
Buttons
| Button | What it does |
|---|---|
| Continue | Validates the current step and moves to the next. |
| Back | Returns to the previous step. |
| Create Account | Submits your details. Paid plans go to secure Stripe checkout; free plans create the account immediately and continue to import. |
If something's missing you'll see a red banner such as Password must be at least 8 characters. Fix the highlighted field and continue.
Onboarding & strategy interview
After your account exists, The Agent runs a short interview to learn your agency, then generates your KPIs and a 12-month strategic plan automatically. A welcome tour points out the key parts of the app.
Phase 1 — Your agency baseline
First you're asked for a quick snapshot so The Agent has real numbers to work from. Every field is a number and can be left blank (it saves as zero).
| Field | Meaning |
|---|---|
| Number of households | Total households in your book. |
| Total auto / fire policies | Policies in force by line. |
| Total auto / fire premium | Premium in force by line ($). |
| Auto / fire lapse rate | Cancellation rate by line (%). |
Buttons: Continue to interview saves your numbers; I don't have these yet skips ahead using zeros.
Phase 2 — The strategy interview
The Agent opens with a greeting and asks about your location, team size, market and goals. Answer in plain English in the chat box and press Send. When it has enough, it writes your KPIs and plan and shows:
“I have successfully generated your KPIs and 12-month Strategic Plan.” — then a Go to Dashboard button. In a hurry? Skip for now jumps straight to the dashboard at any time.
The welcome tour
On your first visit to the dashboard a Welcome modal plays a four-slide intro, then offers Take the tour — a six-step spotlight walkthrough of the sidebar, KPIs, AI brief, producer snapshot, and Ask The Agent. You can replay it anytime from the Help (?) button in the top bar.
Signing in & passwords
Returning users sign in at app.usetheagent.com/login. This page also covers resetting a forgotten password.
Signing in
| Field / control | Notes |
|---|---|
| Email address | The email you signed up with. |
| Password | Use the eye icon to show or hide what you type. |
| Sign In | Signs you in and opens your dashboard (or scorecard for producers). |
| Sign up link | Sends new agencies to the signup wizard. |
A wrong email or password shows a red error banner above the button.
Forgot your password
- Click Forgot password and enter your email on
/forgot-password, then Send Reset Link. You'll see “A password reset link has been sent to your email.” - Open the emailed link. On
/reset-passwordenter your New Password and Confirm New Password (must match, 8+ characters). - Click Reset Password. On success you're redirected to the login page automatically.
Reset links are single-use and time-limited. If yours shows “Invalid or missing reset token,” use Request New Link to get a fresh one.
Dashboard
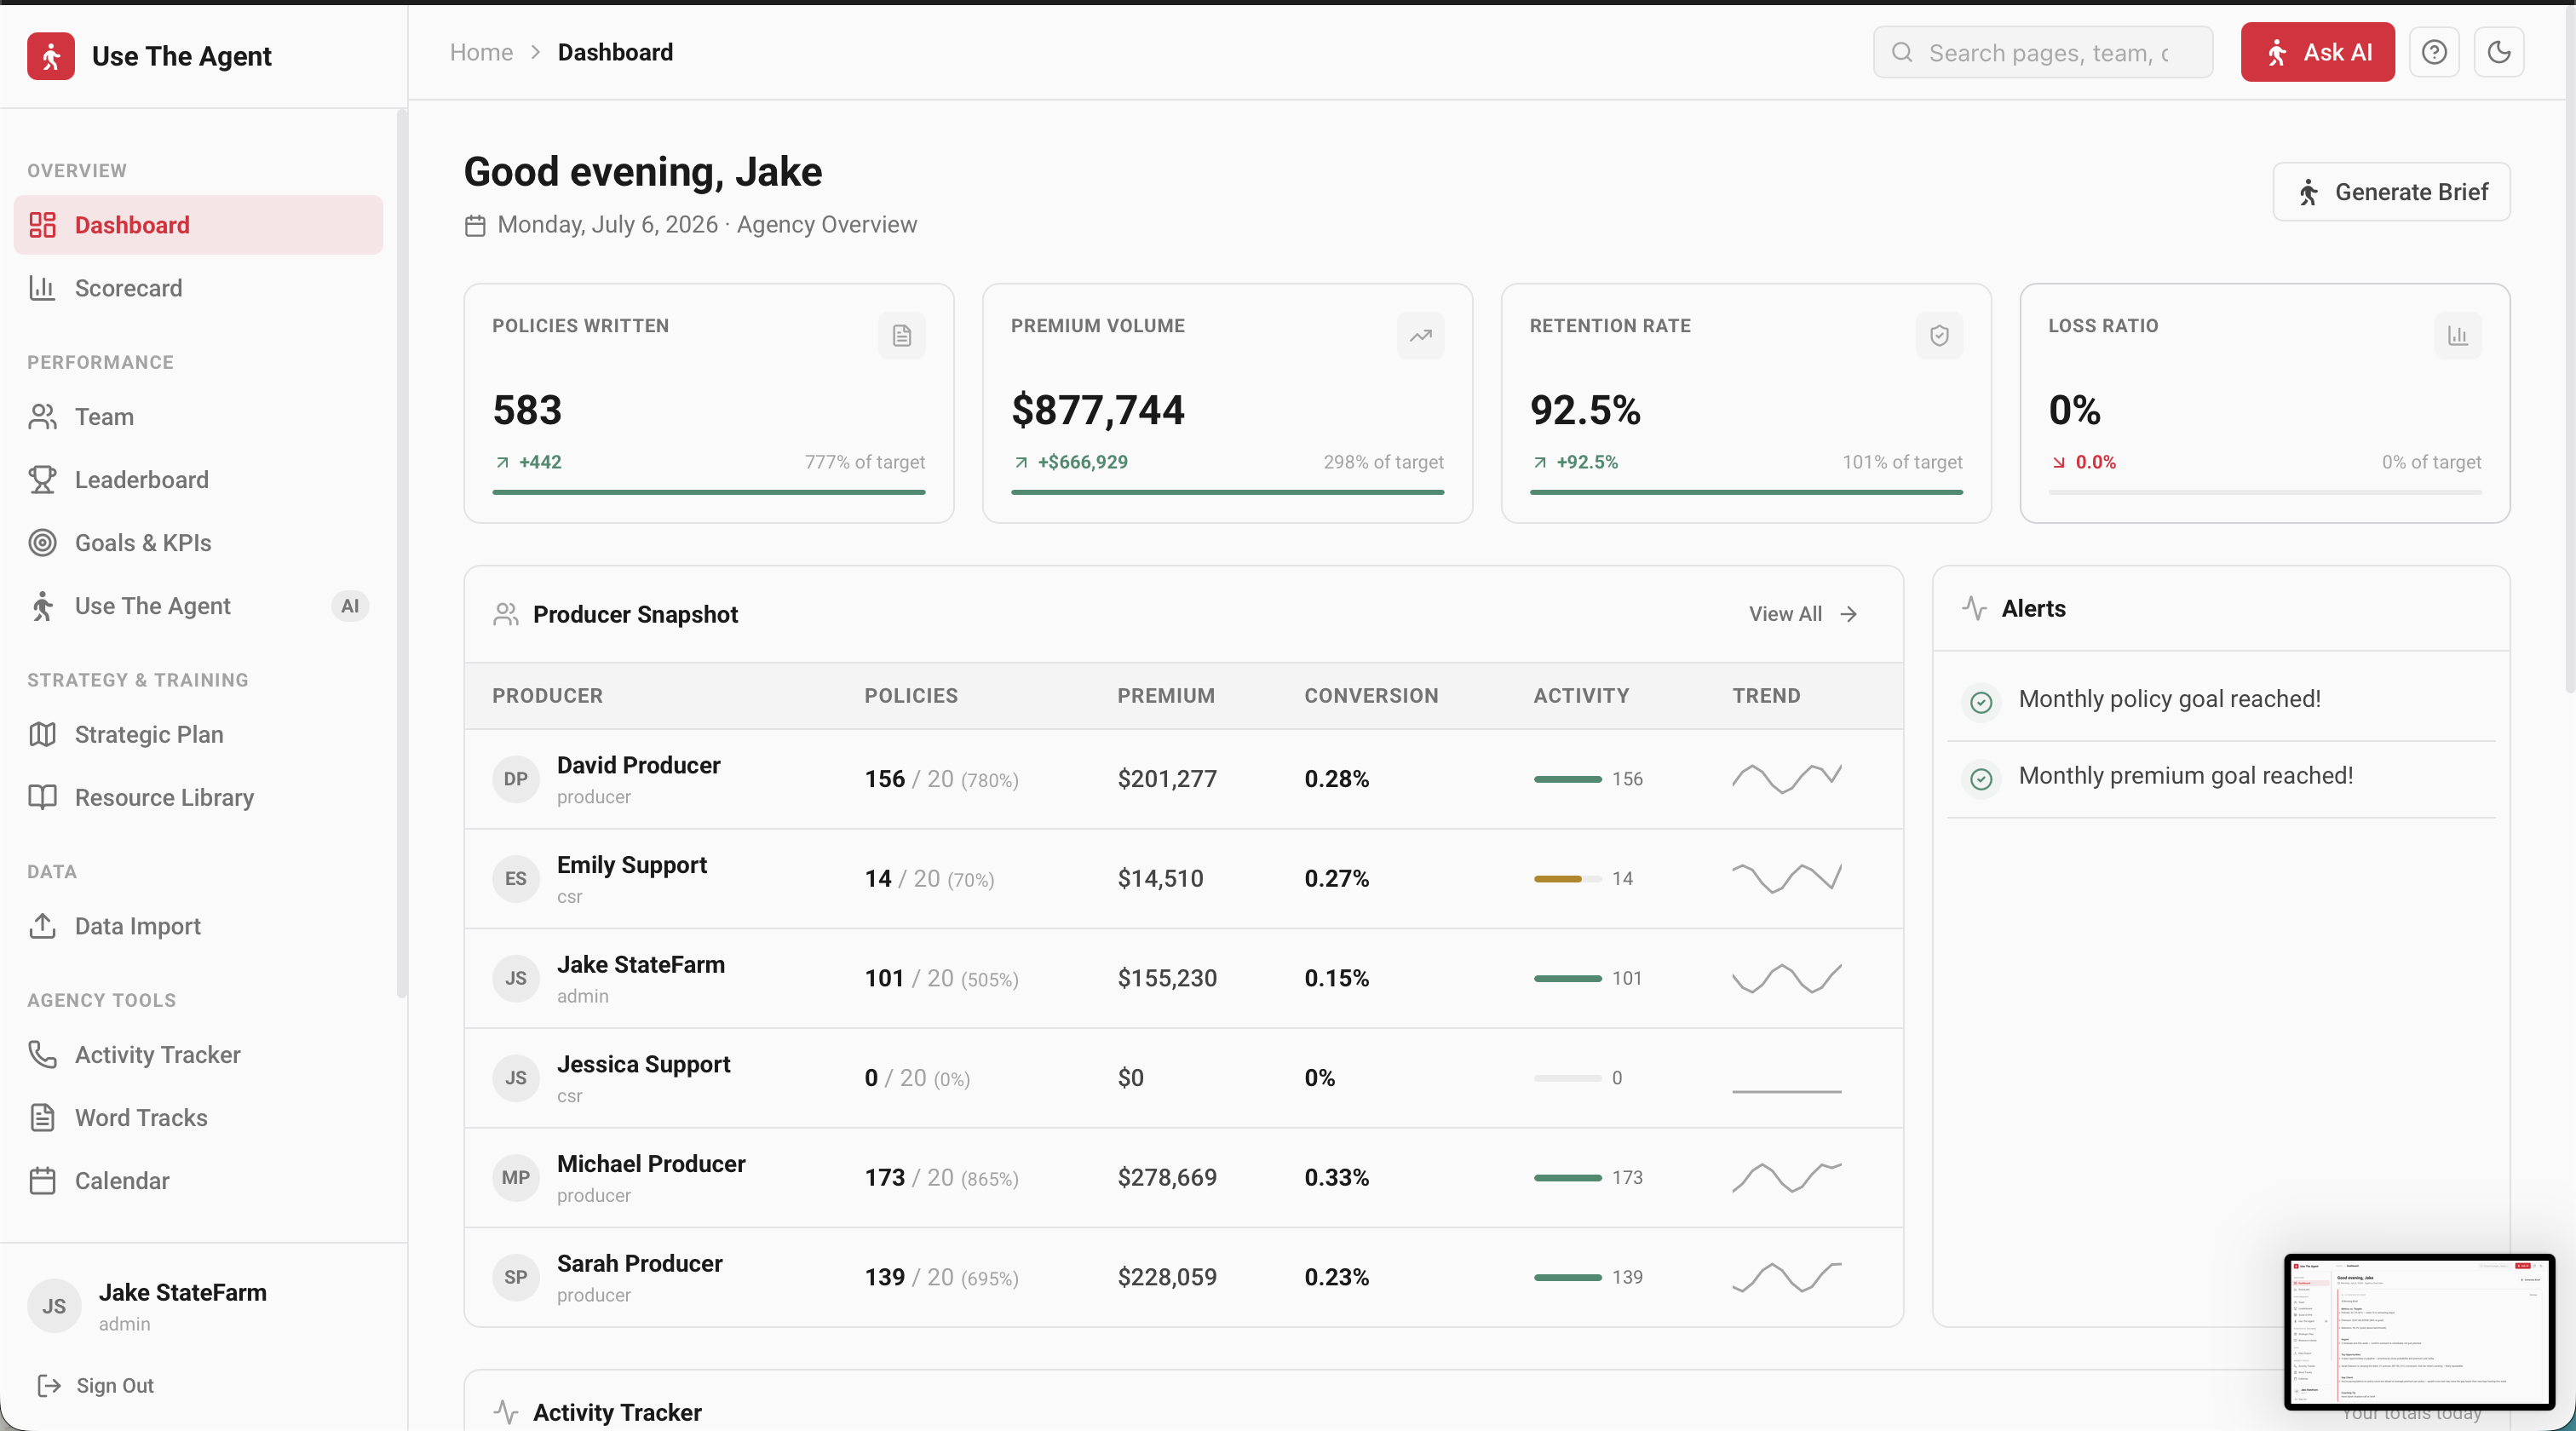
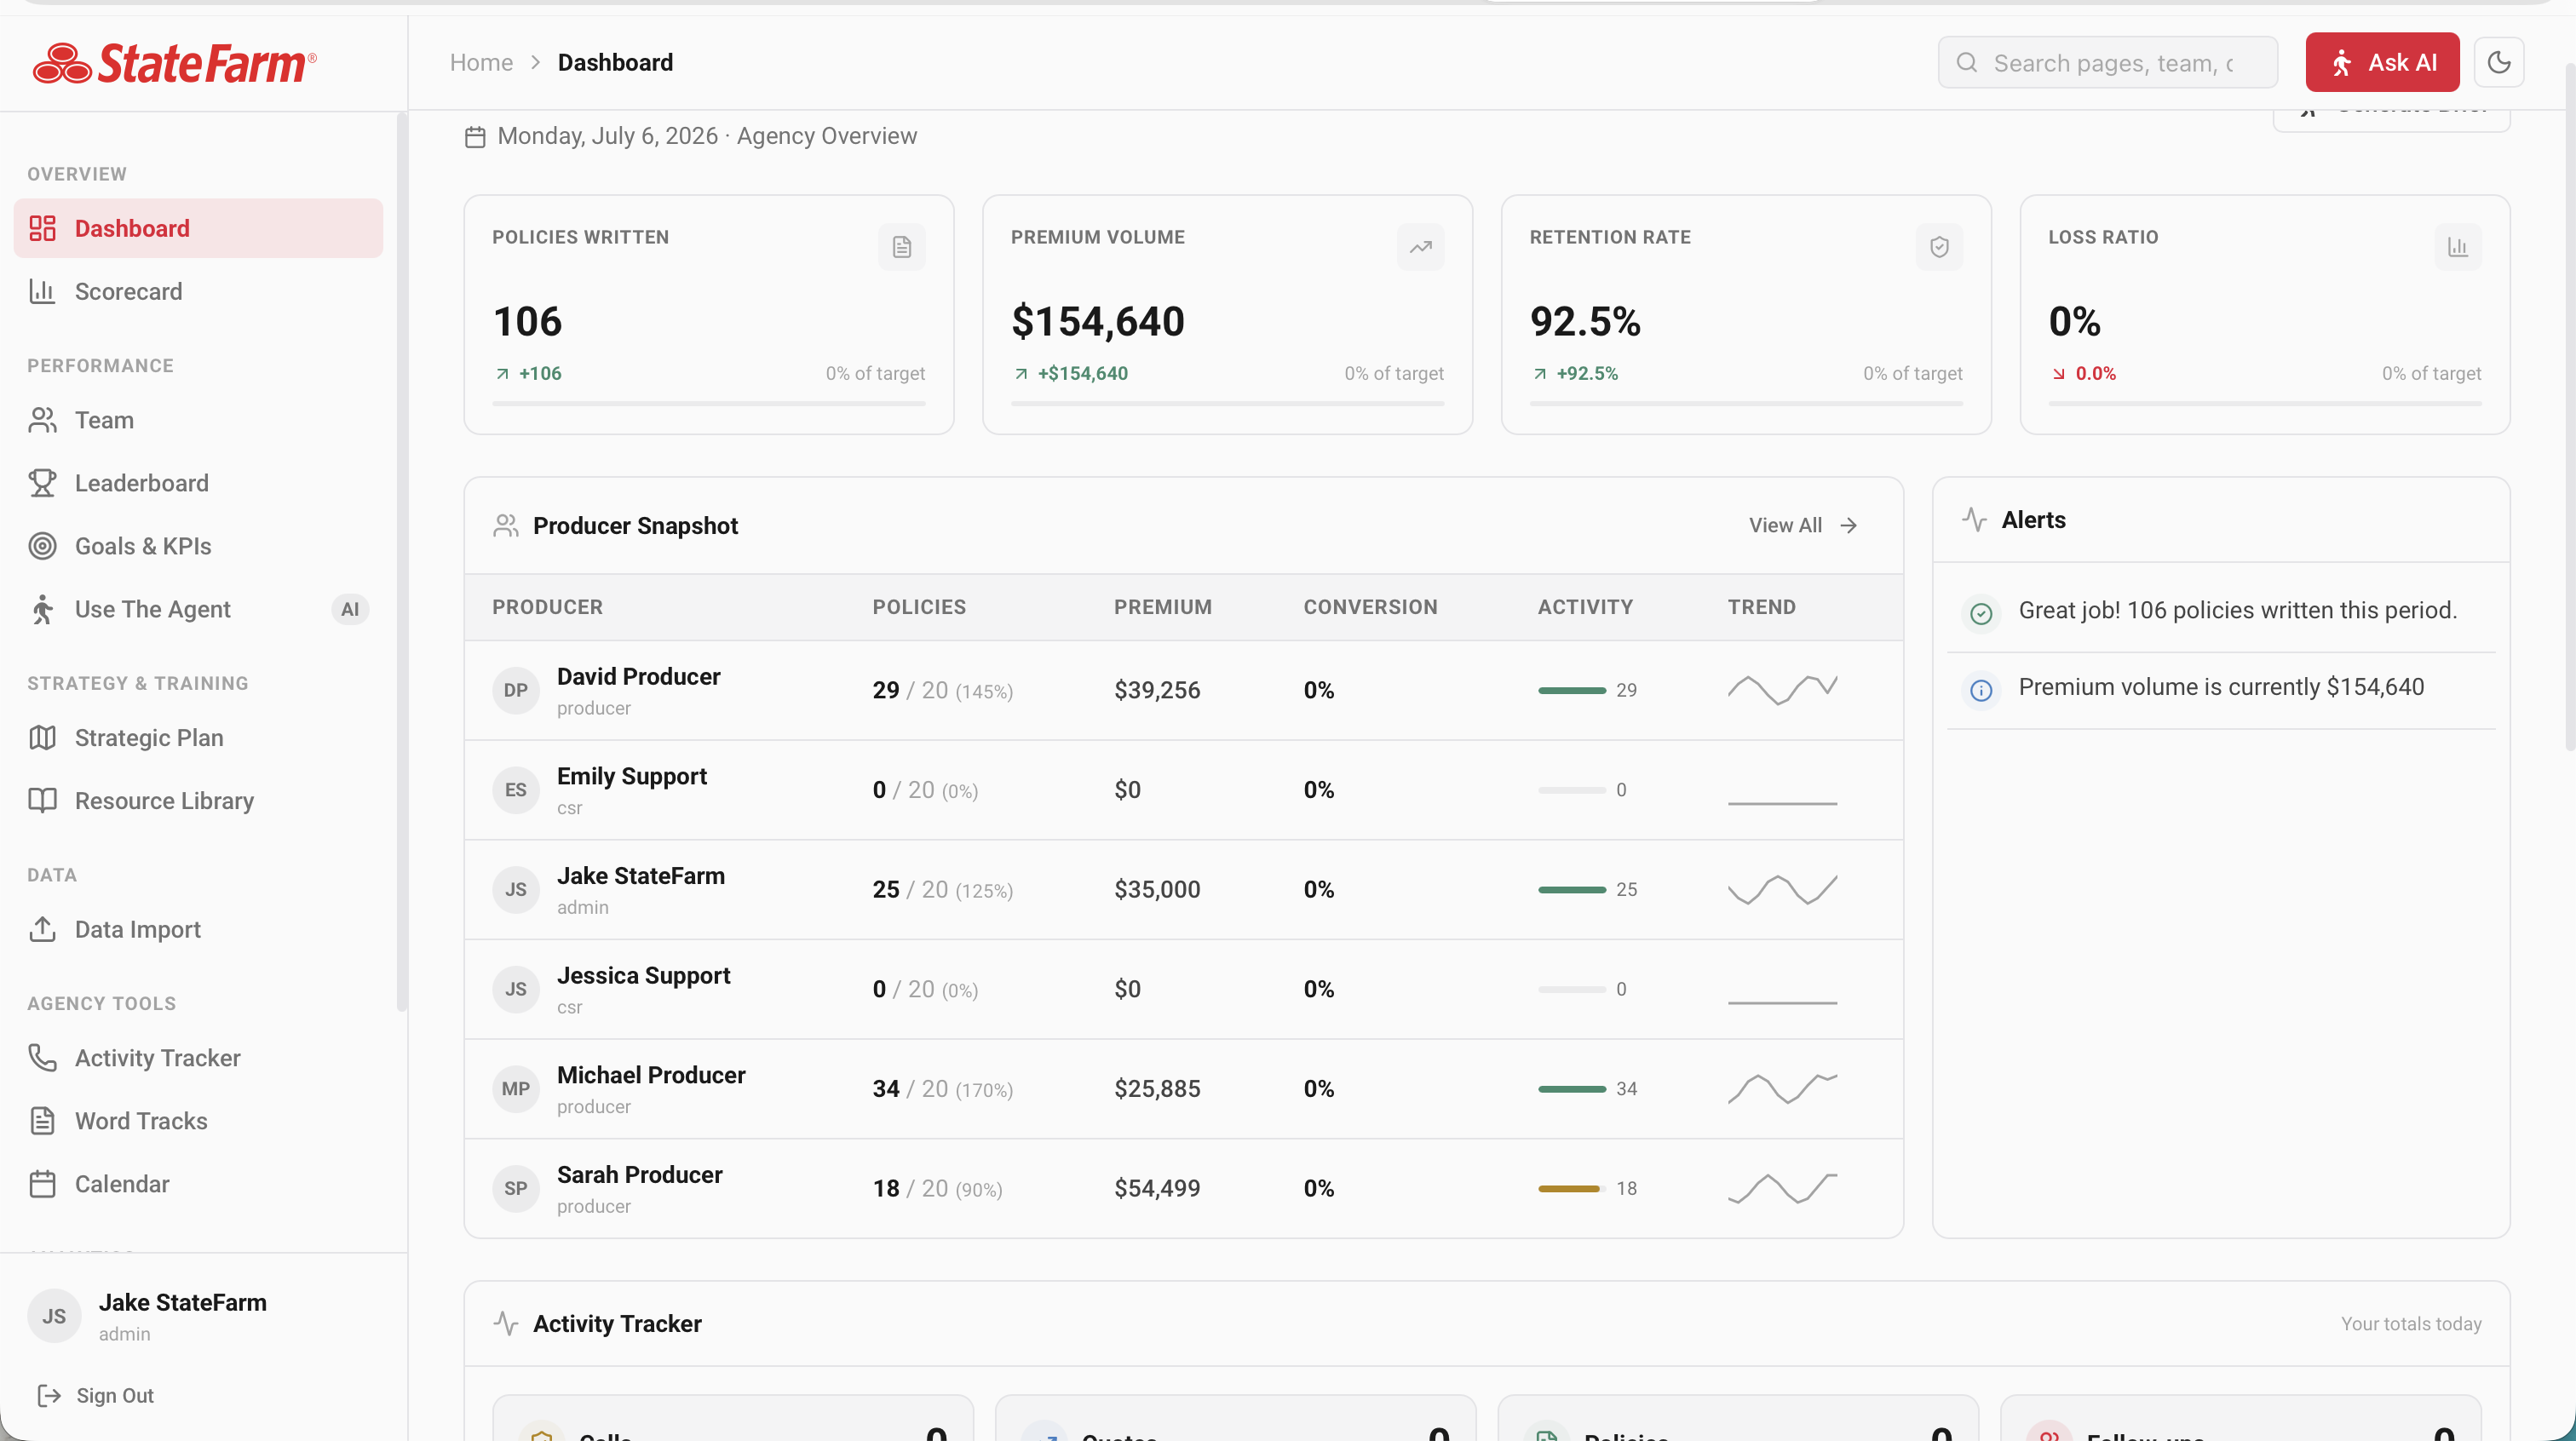
The dashboard is your agency's command center: headline KPIs, an AI brief, a producer snapshot and live alerts — all for the period you choose. Owner / Manager only; producers land on their Scorecard instead.
Choosing a period
The Period card sets the window for every number on the page. Pick Today, Week, Month (default), Quarter, YTD, or Custom — for custom, choose a from/to date and press Apply.
KPI cards
Four headline metrics, each with the current value, the change versus the previous period, percent of target, and a color-coded progress bar (green ≥100%, amber 75–99%, red below).
| KPI | Measures |
|---|---|
| Policies Written | Count of policies bound in the period. |
| Premium Volume | Total written premium ($). |
| Retention Rate | Share of policies retained (%). |
| Loss Ratio | Claims vs premium (%). Lower is better. |
Producer snapshot
A ranked table of producers showing policies vs target, premium, conversion, an activity bar and a trend sparkline. Click any row to open that producer's profile, or View All to open the full Team page.
Alerts
The right-hand panel auto-generates alerts from your data — green wins (“Policy goal reached!”), amber warnings (“Behind on policy goal”, “Retention below target”) and blue info notes. When all is well it reads “No active alerts at this time.”
Generate Brief
The Generate Brief button (top right) writes a plain-English summary of the period — see AI morning brief.
AI morning brief
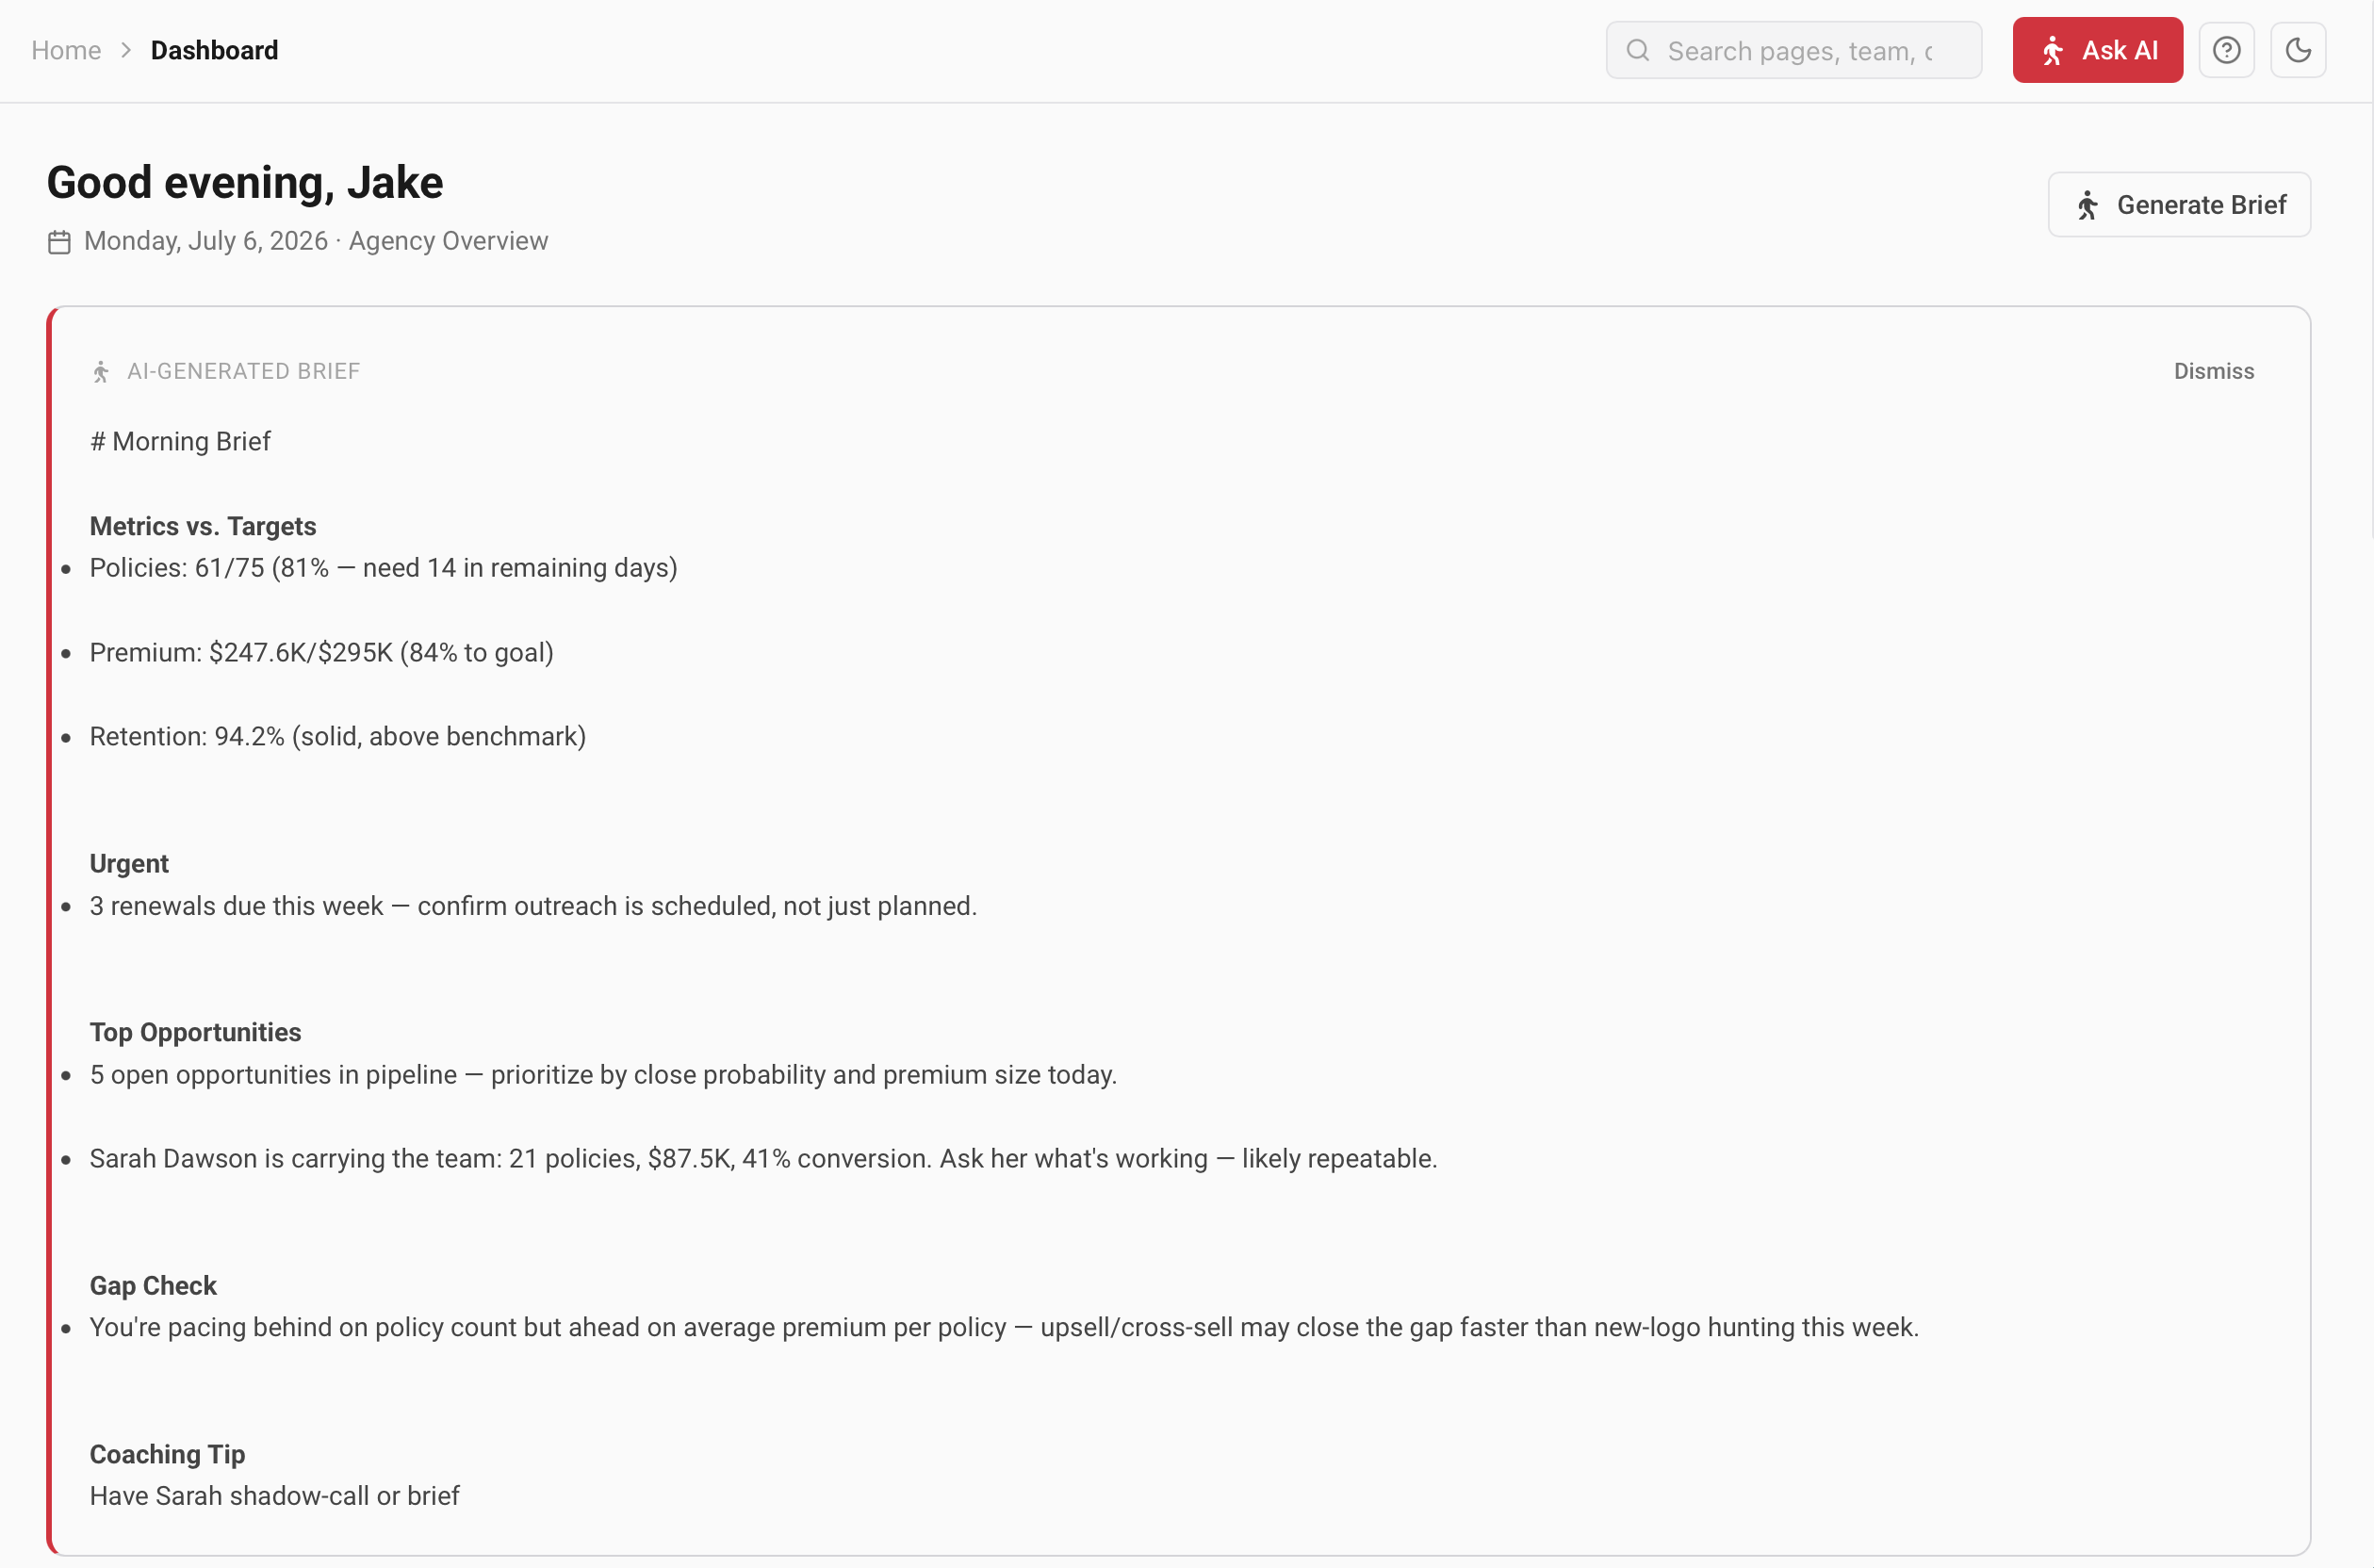
The morning brief is The Agent's plain-English read on how the agency is doing right now — wins, risks, and the handful of moves that matter most — generated on demand from your live data.
How to generate it
- On the Dashboard, click Generate Brief (top right). The button shows “Generating…” while The Agent reads your book.
- The brief appears as a highlighted card with headline metrics vs target, what's urgent, and recommended focus areas.
- Done reading? Dismiss it from the top-right of the card.
Generate a fresh brief after the period selector changes — the summary always reflects the currently selected window.
Scorecard
The scorecard is the home base for producers and the personal/agency performance view for everyone. It tabs between goal progress, agency health metrics, commission and bonuses.
My View vs Agency
Managers get a scope toggle at the top: My View (your own numbers) and Agency (the whole team). Producers see My View only.
Tabs
| Tab | What it shows |
|---|---|
| Activity | Goal progress with a big percent, a milestone progress bar, and a five-metric breakdown: Calls, Quotes, Policies, Premium, Follow-ups. Switch Daily / Weekly / Monthly. |
| Goals | A pointer to the dedicated Goals & KPIs page. |
| Commission | Your commission this month by line of business (My View), or a producer-by-producer commission table with an agency total (Agency View). |
| Bonuses | Agency View Bonus-tier progress toward the next reward. |
Agency health (Agency View)
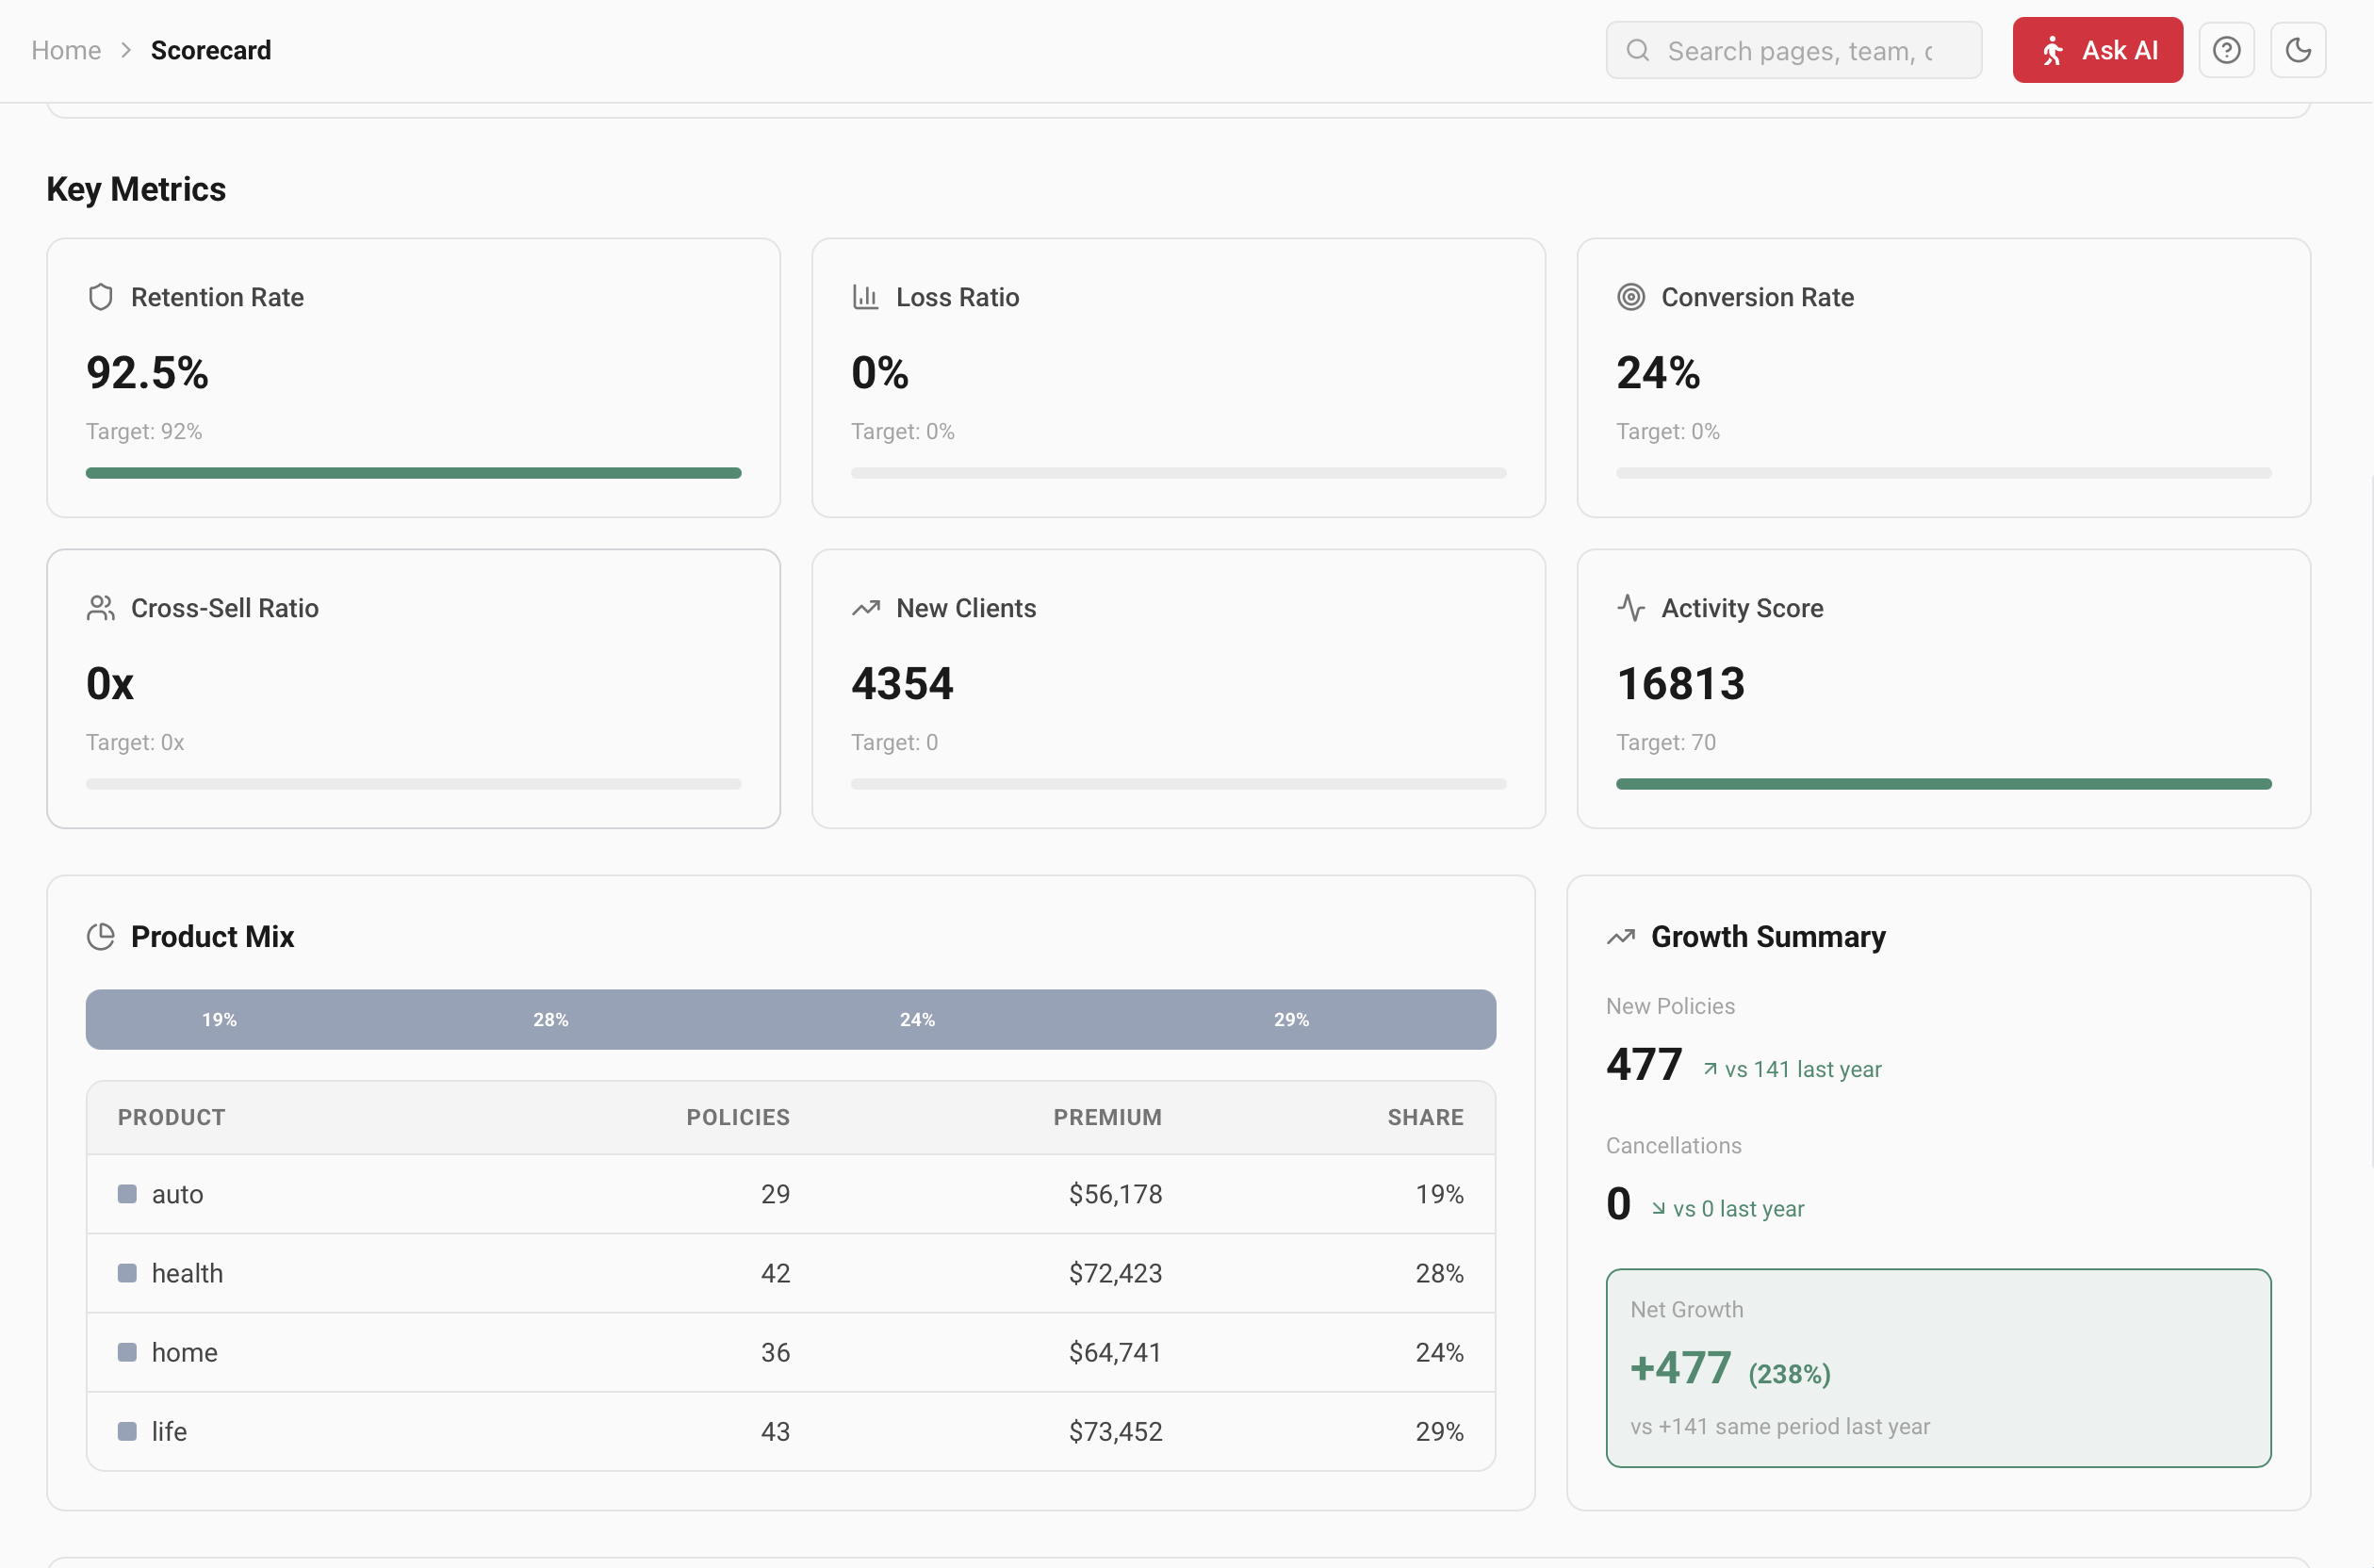
In Agency View the Activity tab adds key metrics (retention, loss ratio, conversion, cross-sell, new clients, activity score), a Product Mix bar and table, a Growth Summary (new policies, cancellations, net growth vs last year) and an 11-month Retention Trend chart.
Team
The Team page ranks your producers and shows how the whole team is pacing for the chosen period. Owner / Manager only.
Period selector
Buttons at the top right switch the window: This Month (default), Last Month, Last Quarter, YTD. Every stat and rank below updates to match.
Team summary
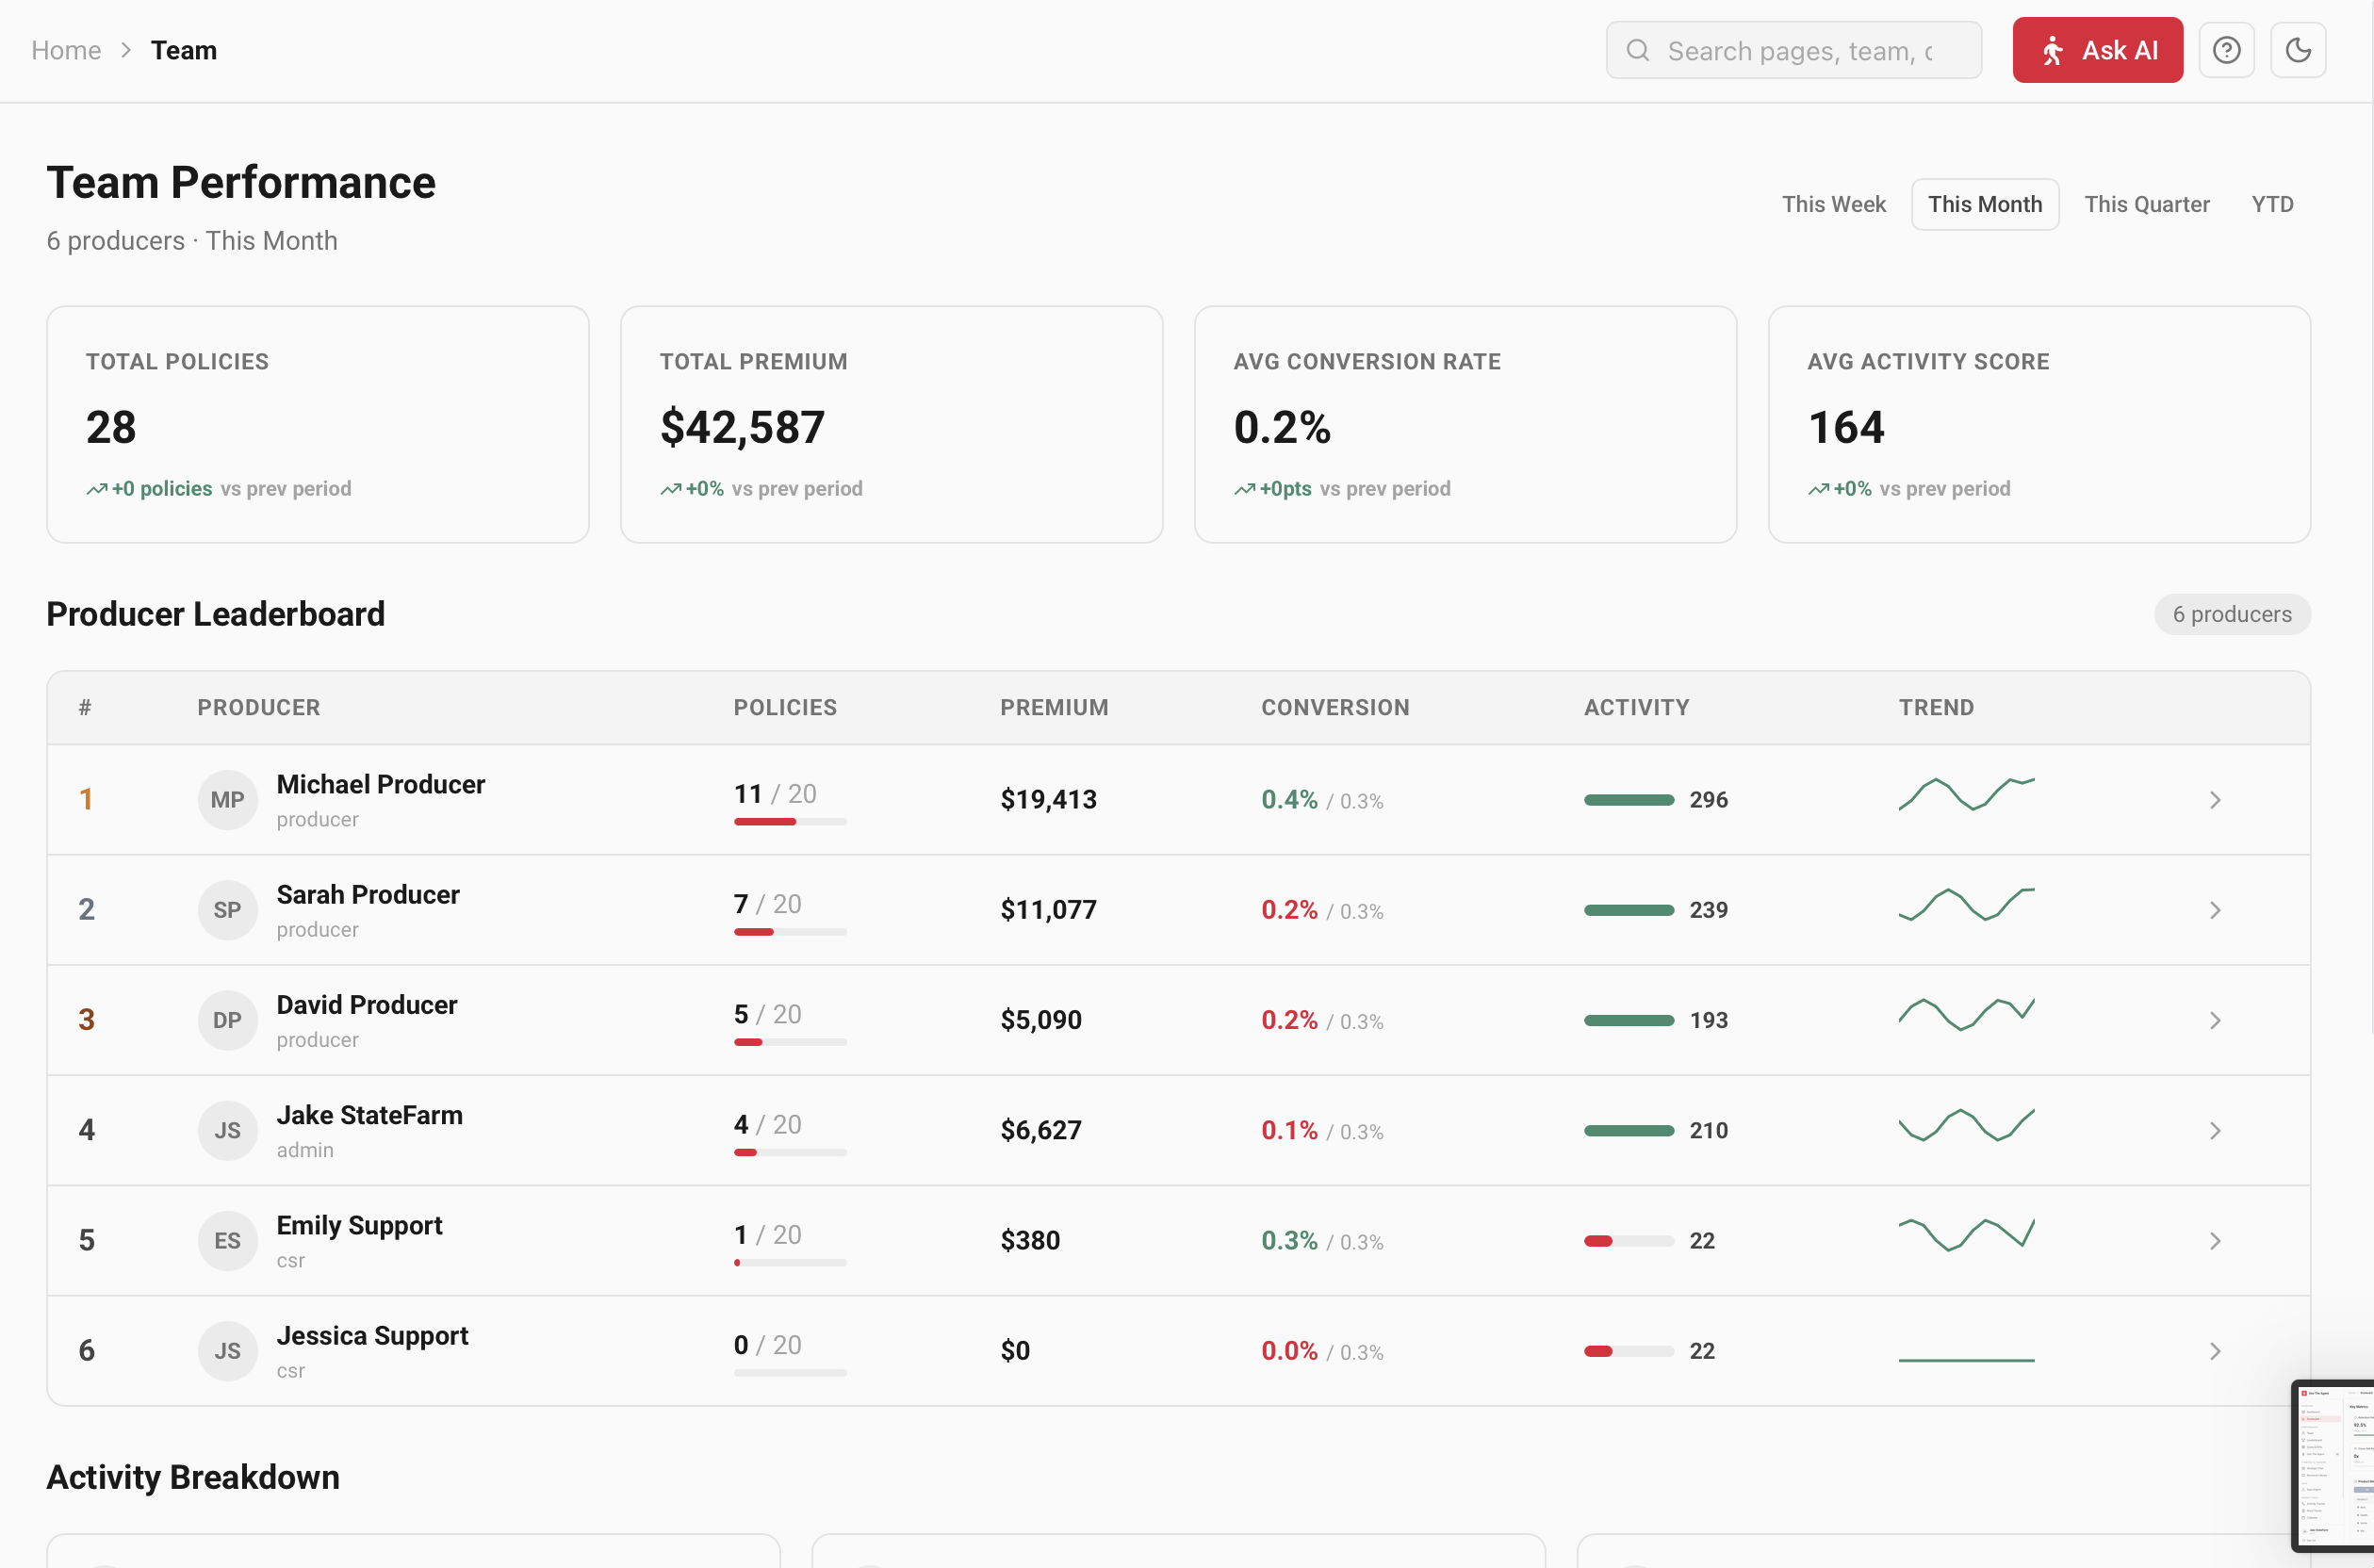
Four cards headline the team: Total Policies, Total Premium, Avg Conversion Rate and Avg Activity Score.
Producer leaderboard
A ranked table (top three get gold/silver/bronze styling) with these columns:
| Column | Shows |
|---|---|
| # | Rank. |
| Producer | Avatar, name and role. |
| Policies | Count vs target with a mini progress bar. |
| Premium | Written premium ($). |
| Conversion | Conversion % vs target, color-coded. |
| Activity | Activity score with a small bar. |
| Trend | A 12-period sparkline. |
Click any row to open that producer's profile. Below the table, an Activity Breakdown grid compares calls, emails and meetings per producer.
Producer profile
Opening a producer (from the Dashboard snapshot or the Team leaderboard) shows their full performance picture, recent activity and AI coaching suggestions.
Header
Avatar, name, role and hire date, plus a status badge: green On Track when conversion meets target, amber Needs Attention when it doesn't. ← Back to Team returns to the list.
KPI cards
Policies Written, Premium Volume, Commissions Earned, Conversion Rate, Retention Rate, Activity Score and Quotes Generated — each against target where one exists. If Employee ROI is enabled, an ROI card appears too.
Trend & recent activity
A 12-period performance trend chart sits beside a scrollable Recent Activity feed (up to 8 items). Managers can remove a logged item with its trash icon.
AI coaching suggestions
The Agent writes 2–3 targeted tips from this producer's numbers — for example “Review Pipeline Quality” when conversion is below target, or “Close the Policy Gap” when they're a few policies short — each with a concrete next action.
Employees & ROI
The Employees page tracks each producer's annual compensation so the app can show return on investment. Owner / Manager, and only when Employee ROI is switched on in Preferences.
How ROI is calculated
ROI = (premium − compensation) ÷ compensation. The page states this formula in its subtitle so the number is never a black box.
The table
| Column | Notes |
|---|---|
| Employee | Name, avatar and role. Click to open the producer profile. |
| Premium | Premium written by that producer. |
| Annual Compensation | An inline field you edit directly. Min 0, steps of $1,000. |
| ROI | Recalculated live — green ≥100%, amber 0–99%, red below zero, dim if no comp set. |
| Action | Save — enabled once you change the value; shows a checkmark and “Saved” for a moment. |
No producers yet? You'll see “No producers yet” with a Go to Team button.
Leaderboard
The Leaderboard ranks your agency against others and lets you connect with agencies to compare breakdowns. Two tabs: Global Leaderboard and Connections.
Joining the board
A banner shows whether you're listed. Join the board opts in (only your agency name and total premium are shared); Leave board opts out. Your producer-level breakdown stays private unless you connect with another agency.
Global rankings
Use Rank by to sort the table by Premium, Policies, Calls, Quotes or Follow-ups. Columns include rank, agency (yours is badged “You”), the five metrics, and salespeople count. Click a row to open that agency's overview — locked until you're connected.
Connections tab
| Section | What you can do |
|---|---|
| Find agencies | Search by name and send a Connect request (or Accept an incoming one). |
| Requests received | Accept or Decline incoming requests. |
| Requests sent | Withdraw a pending request. |
| Connected agencies | View overview to see their KPIs and salespeople, or remove the connection. |
Activity tracker
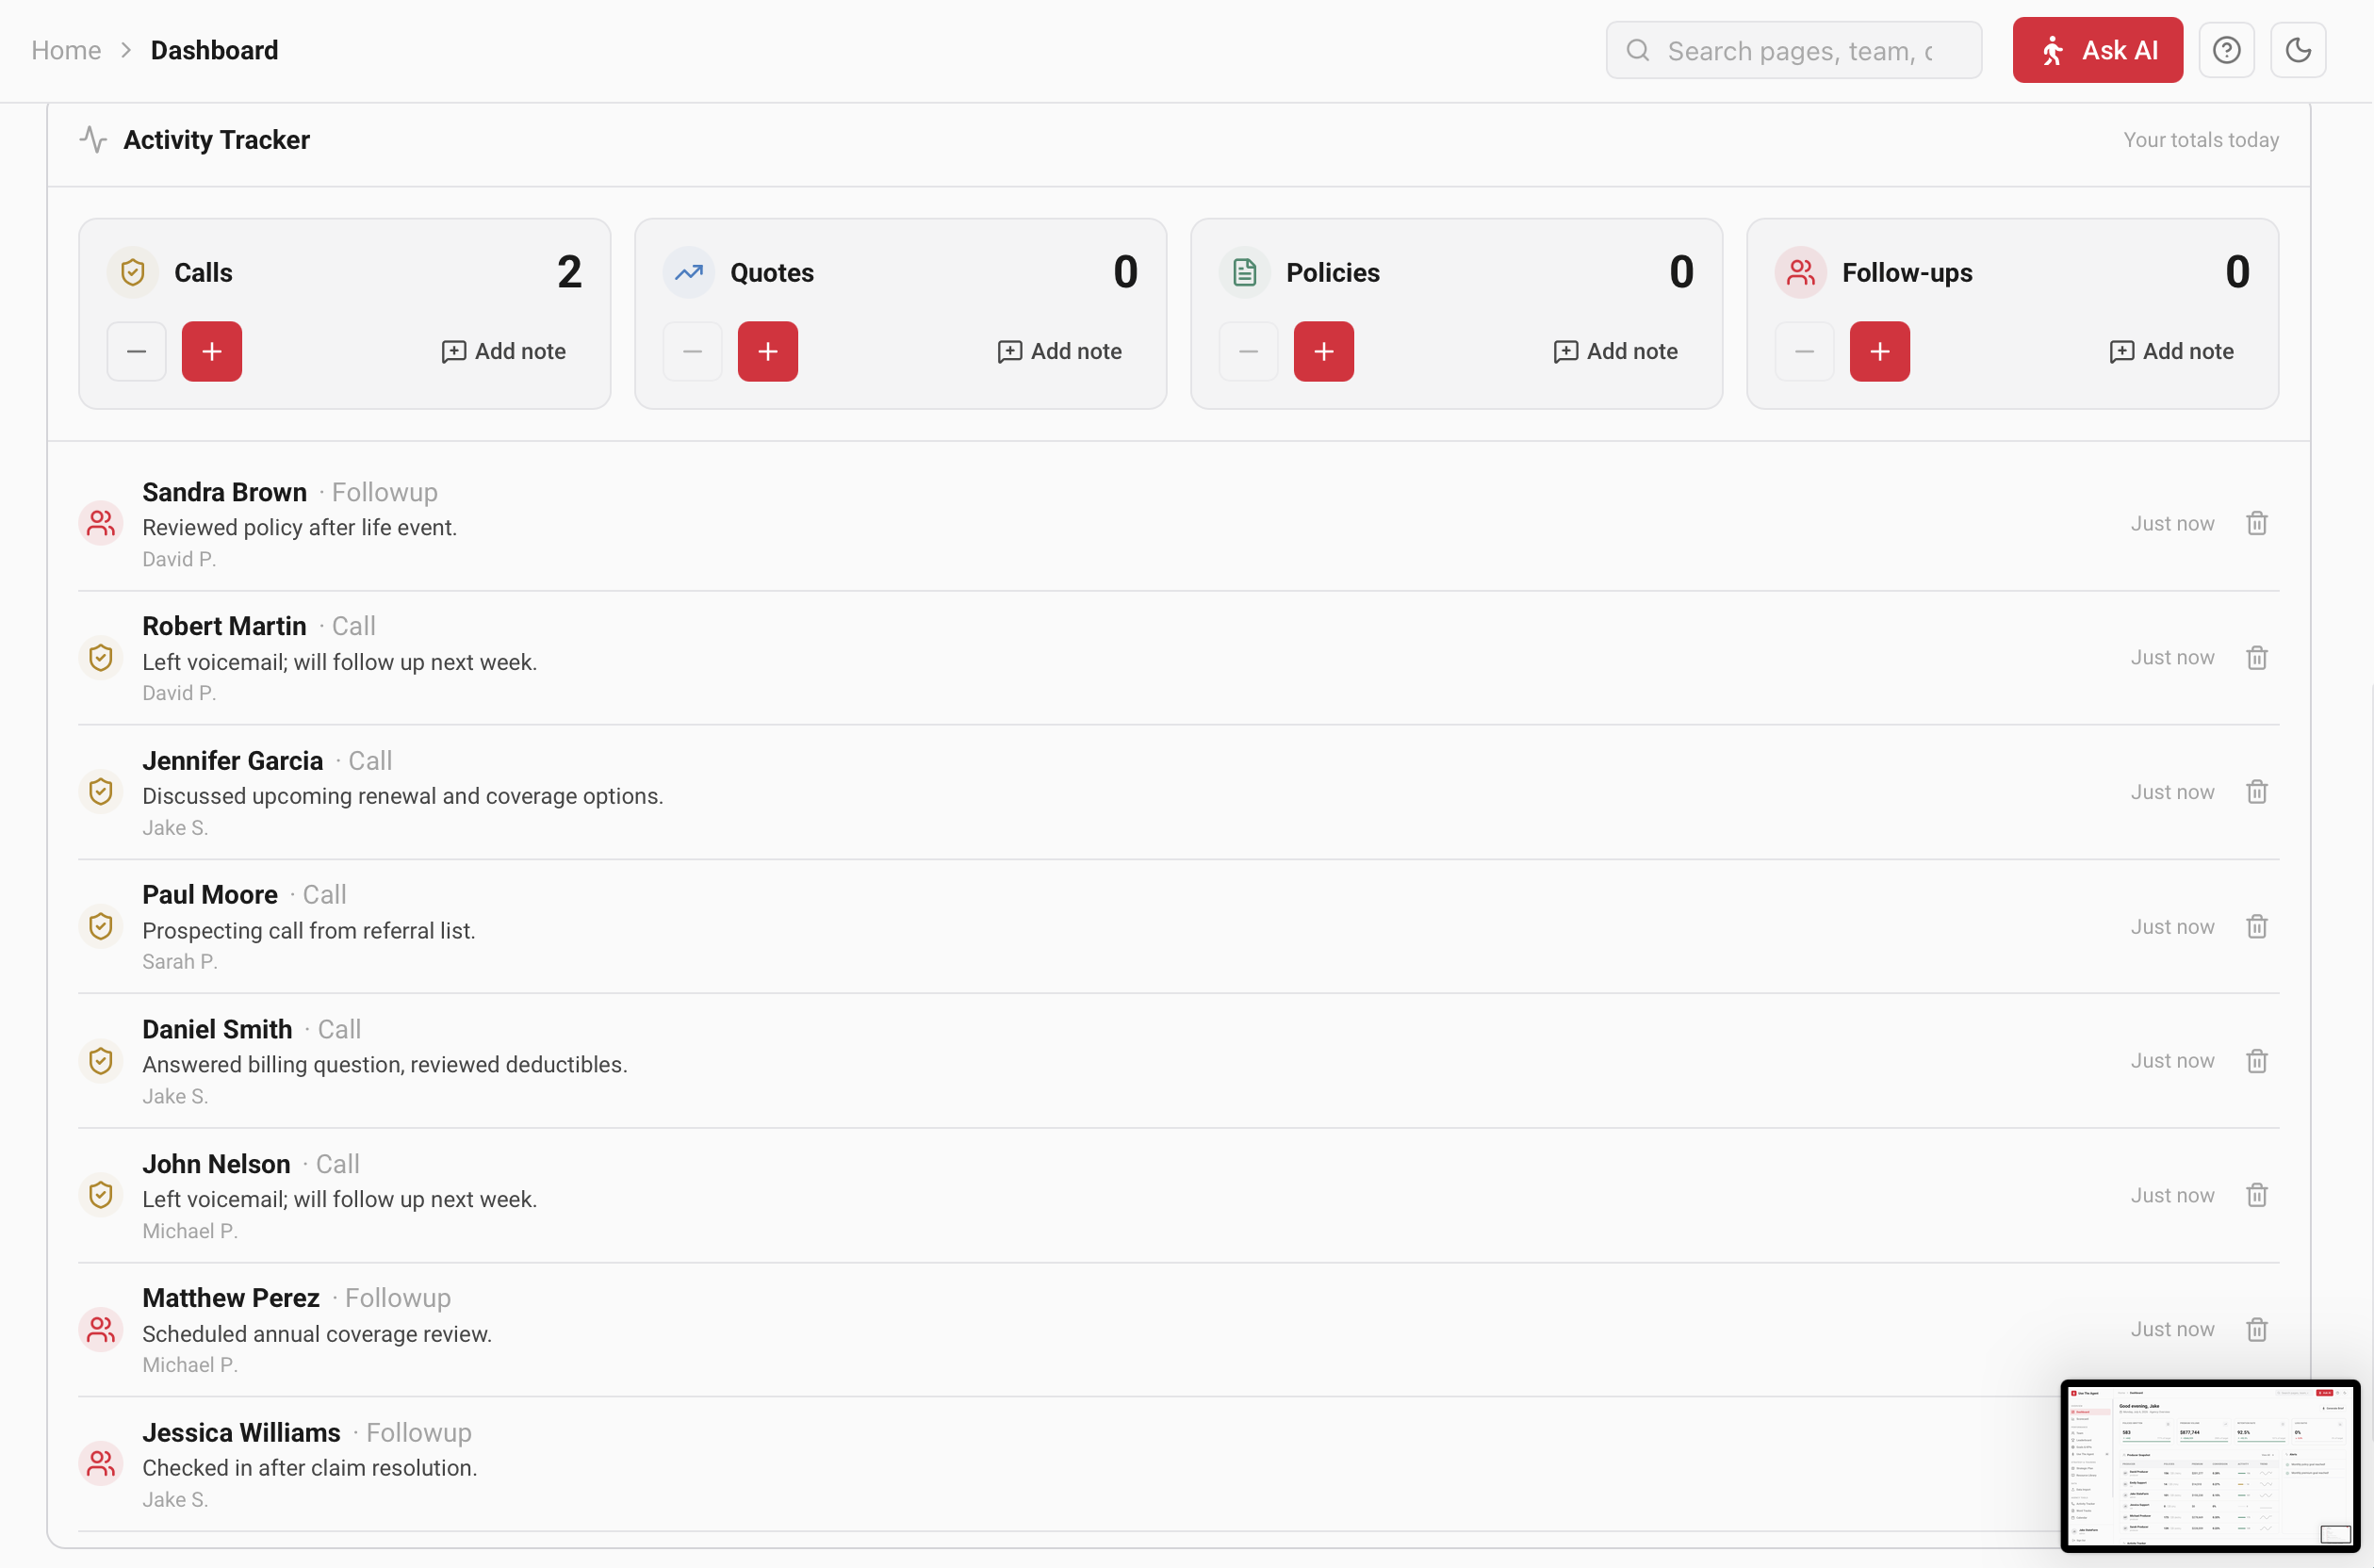
Activity is the leading indicator of a strong month. The tracker logs calls, quotes, policies, follow-ups and any custom activity your agency defines — one click each — and rolls them into every dashboard.
Logging activity
Activity is logged from the tracker cards (on the dashboard and this page). Each activity type is a card with today's count and controls:
| Control | What it does |
|---|---|
| + (plus) | Adds one to that activity type instantly. |
| − (minus) | Removes the most recent one (disabled at zero). |
| Add note | Opens a small form to log with a client name, notes and — for policies/quotes — a premium amount. |
Some custom fields require a note; for those the form won't submit until you add one.
The activity feed & totals
The /activity-tracker page shows the day's totals per metric (with targets) and a filterable feed. Use the Type dropdown to narrow to Calls, Quotes, Policies Bound, Follow-ups or a custom field. The table lists time, agent, type and the client & notes; page through with Previous / Next.
Producers see their own activity and totals. Managers see the whole team in one feed with agency-wide totals.
Sales ledger
The sales ledger is the searchable record of every imported policy, with totals up top and one row per policy below. Owner / Manager (needs the “view sales records” permission).
Summary cards
When policies exist you get four totals: Policies, Written Premium, Issued Premium and Avg Premium.
Filtering
| Filter | Notes |
|---|---|
| Search | Matches policy name, notes and producer. |
| Product | Narrow to one product line. |
| Policy type | Narrow to one policy type. |
| Producer | Narrow to one producer. |
| Written from / to | Date range on the written date. |
| Clear | Appears when any filter is active; resets everything. |
The table & export
Columns: Product, Policy Name, Written By, Policy Type, Written date, Issued date, Written Premium and Issued Premium. Click a header to sort. Export CSV downloads the current filtered view; Import Sales opens the policy-sales importer. Empty? “No sales imported yet” points you to the importer.
Book of business
Track monthly snapshots of households, policies in force and premium by line — entered by hand or imported — to see growth and retention over time. Owner / Manager.
KPI cards
Households, Policies in Force, Total Premium (each with growth vs the prior period), New Business, Cancellation Rate (with retention beside it) and a Snapshots count.
Adding a period
- Click Add Period to open the editor.
- Set the Period Month and optional label, then enter households and, for each line (Auto, Home/Fire, Life, Health, Other), the Policies and Premium ($).
- Add New Business and Cancellations figures and any notes, then Save Period.
Importing instead
Template downloads a ready-to-fill CSV; Import CSV uploads a filled sheet (.csv/.xlsx). Each saved period appears in a table with premium-growth arrows and inline Edit / Delete controls.
Sales forecast
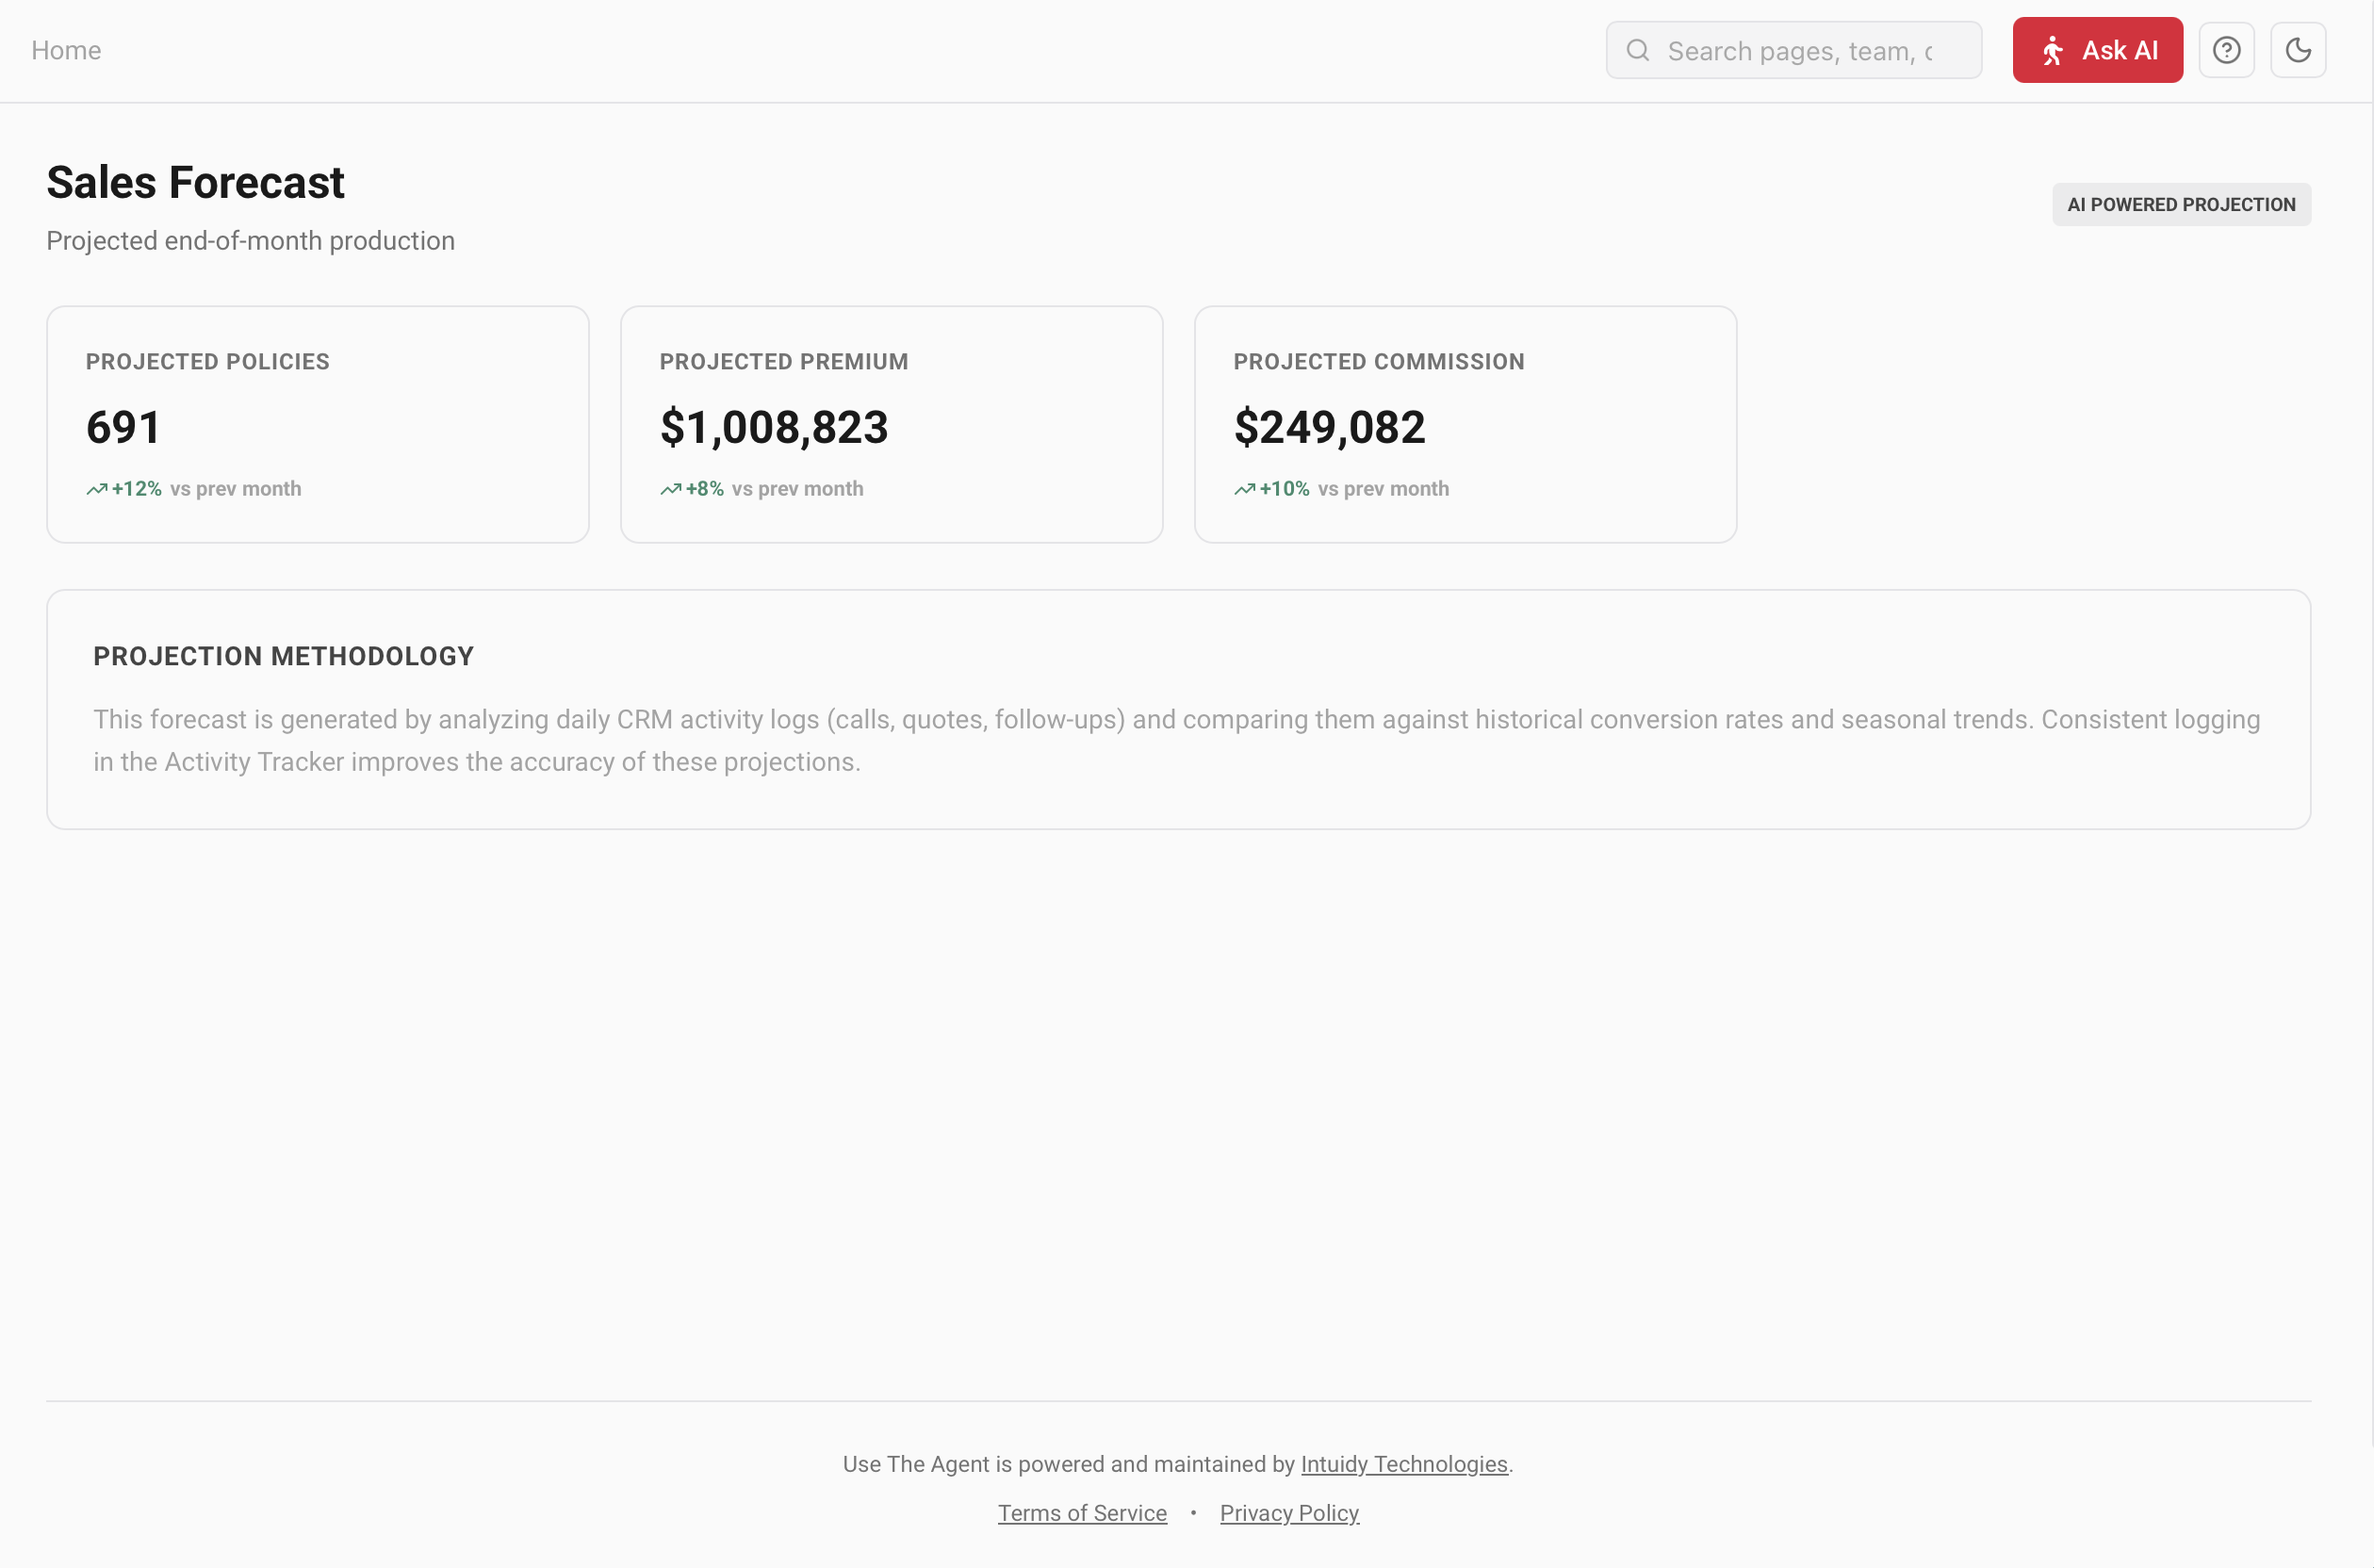
The forecast projects where the period will land — premium, policies and commission — from your real activity and historical conversion, with a confidence band rather than a guess. Premium feature.
Scope & range
Managers can switch View between the whole agency and any producer; producers see their own. Choose a range: Day, Week, Month (default), Quarter, YTD or Custom.
What it shows
Four hero cards (Projected Premium, Policies, Commission and Period Progress) each show a “likely low–high” range and percent of goal. Below sit a cumulative trajectory chart with a confidence band, a daily-activity trend, a sales funnel, goal pacing, and — for the agency — a producer comparison.
Forecast Lab
Open Forecast Lab to run scenarios: a pace-change slider (−50% to +50%), baseline and momentum windows, a momentum cap, confidence-band width, and an outlier-trim toggle. Reset returns to defaults.
Remaining days are projected at your trailing 90-day average daily production, nudged by a recent-month momentum factor (capped ±20–30%). The shaded band is an ~80% range from historical variation — it doesn't assume growth. Completed periods show actuals, not projections.
Close ratios
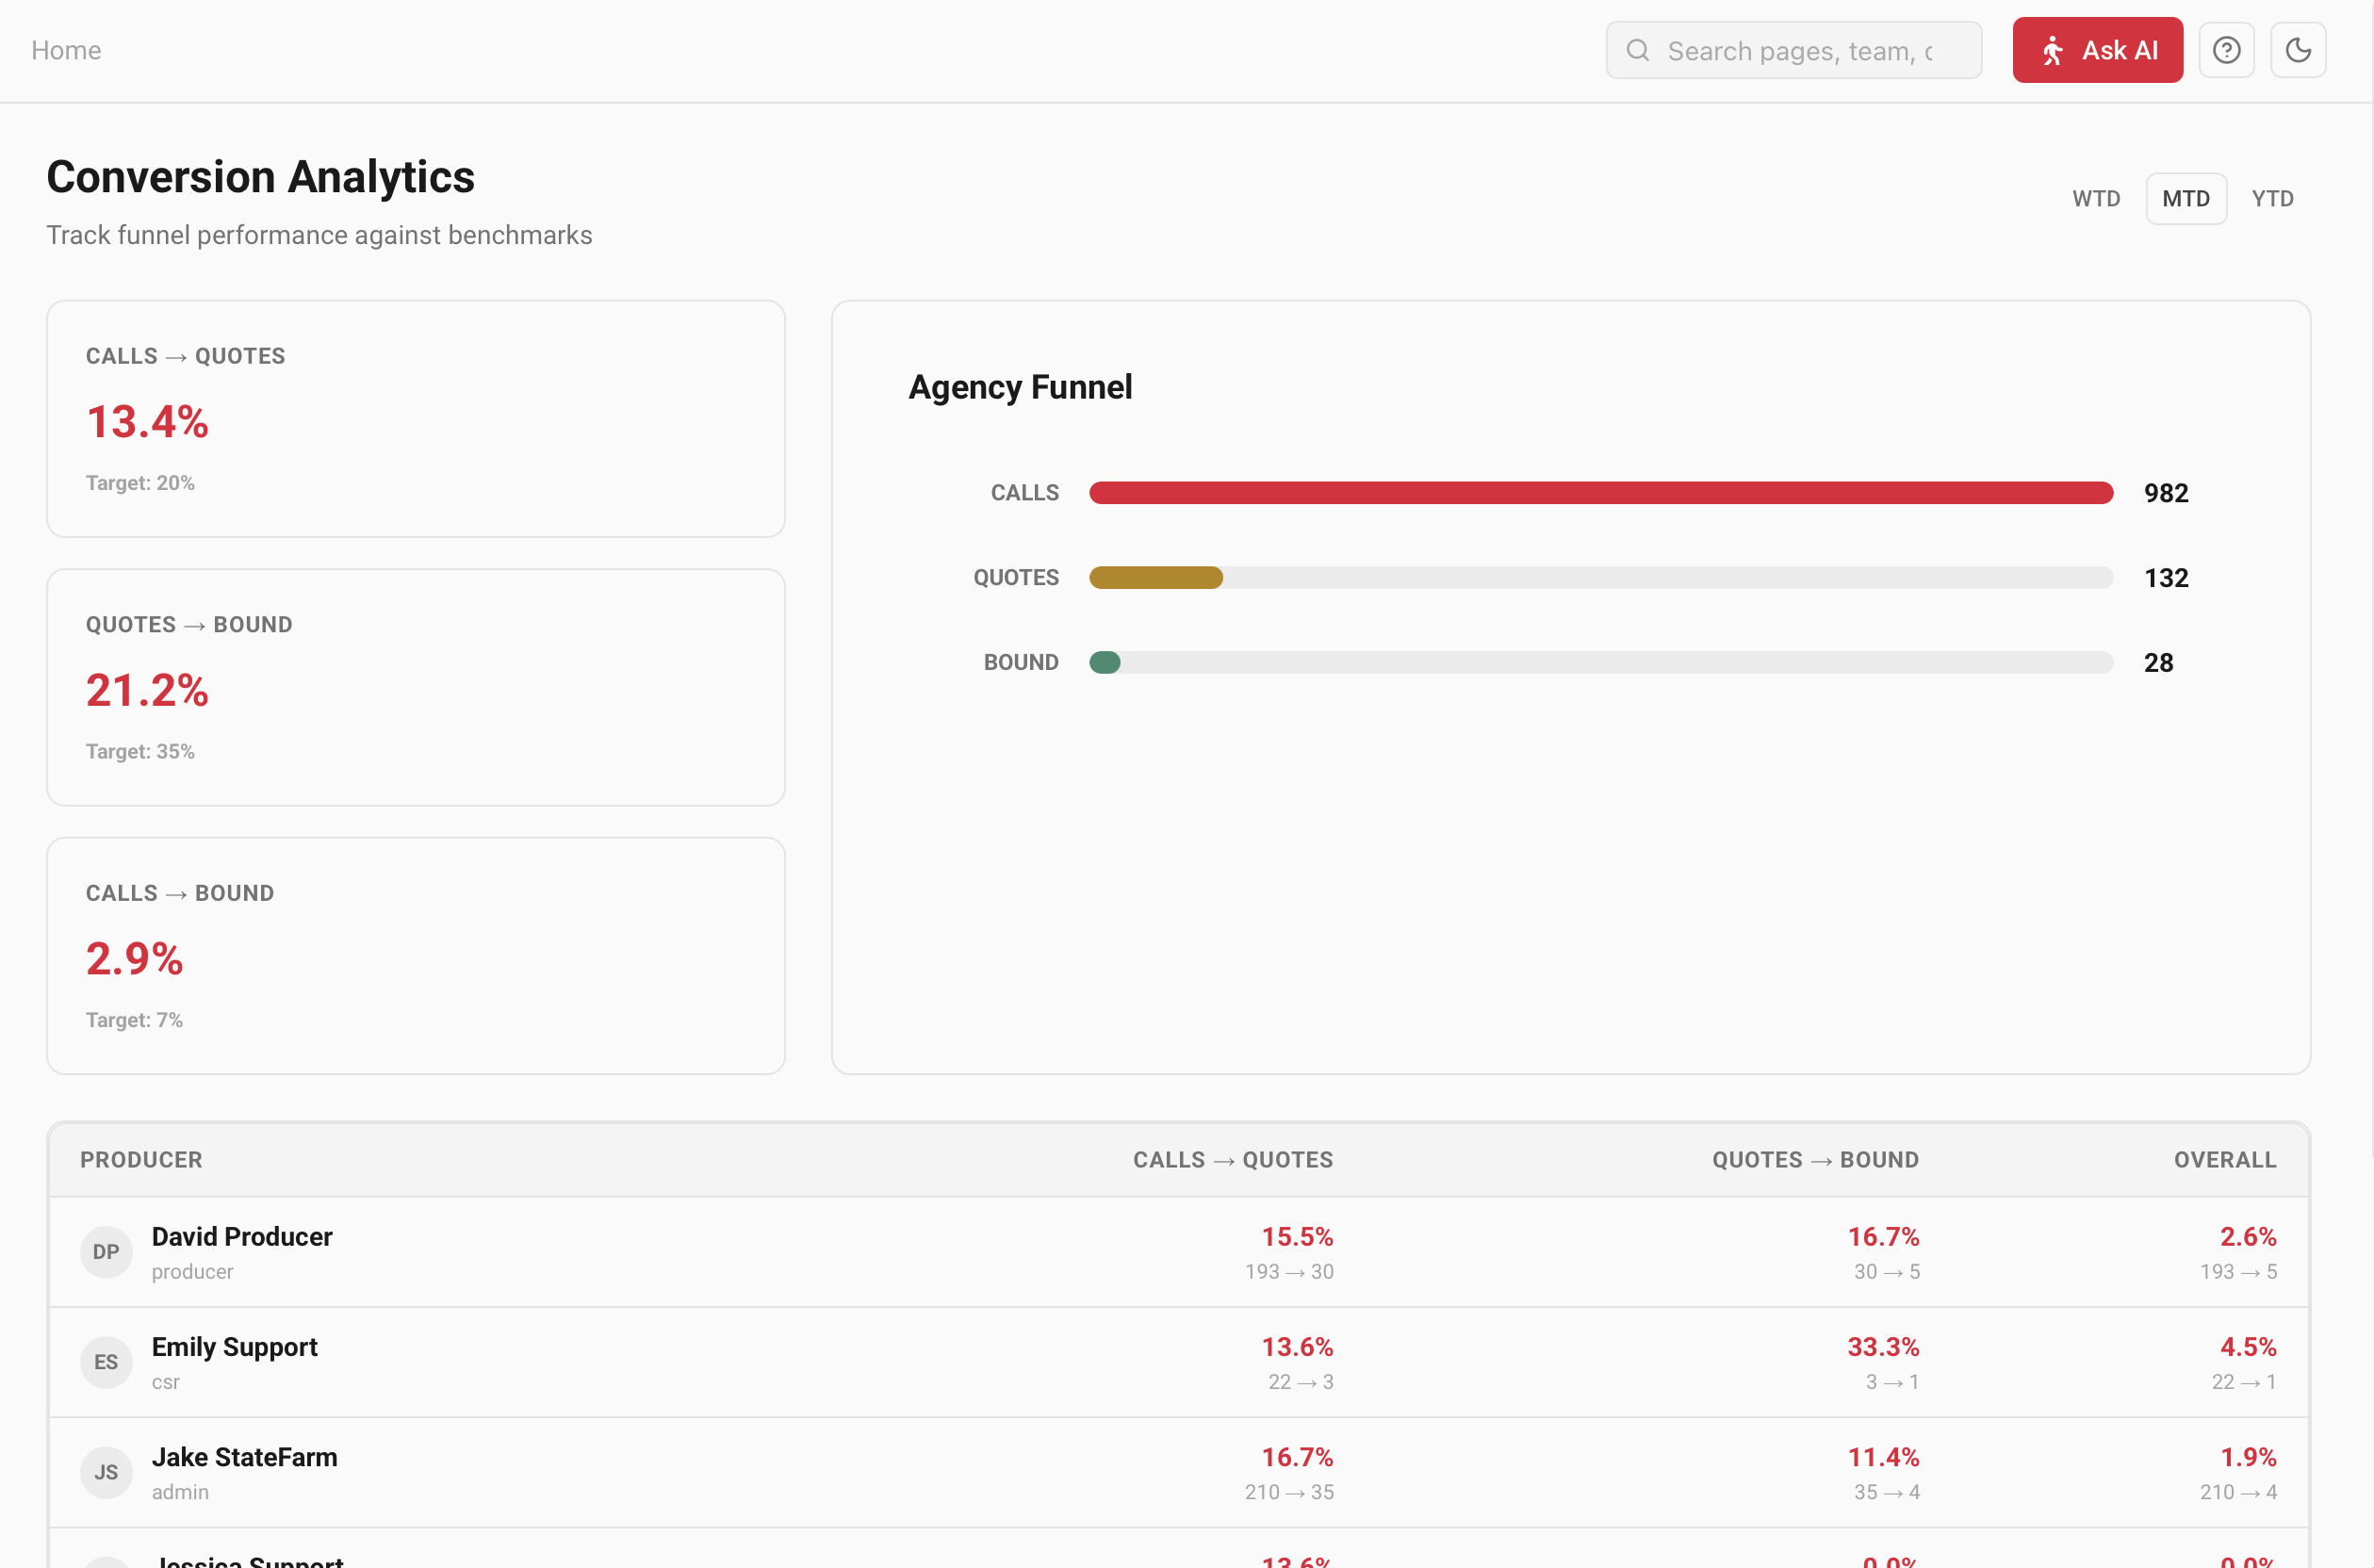
Close ratios track your conversion funnel — calls → quotes → bound — against benchmarks, for the agency and each producer, so you can see exactly where deals are won and lost. Premium feature.
Timeframe
Toggle WTD, MTD (default) or YTD to reload the whole page for that window.
The three ratios
| Ratio | Benchmark |
|---|---|
| Calls → Quotes | Target 20%. |
| Quotes → Bound | Target 35%. |
| Calls → Bound (overall) | Target 7%. |
Each card is green at or above target, red below. An Agency Funnel visual shows calls, quotes and bound side by side, and a producer table breaks the same three ratios down per person.
Ask The Agent
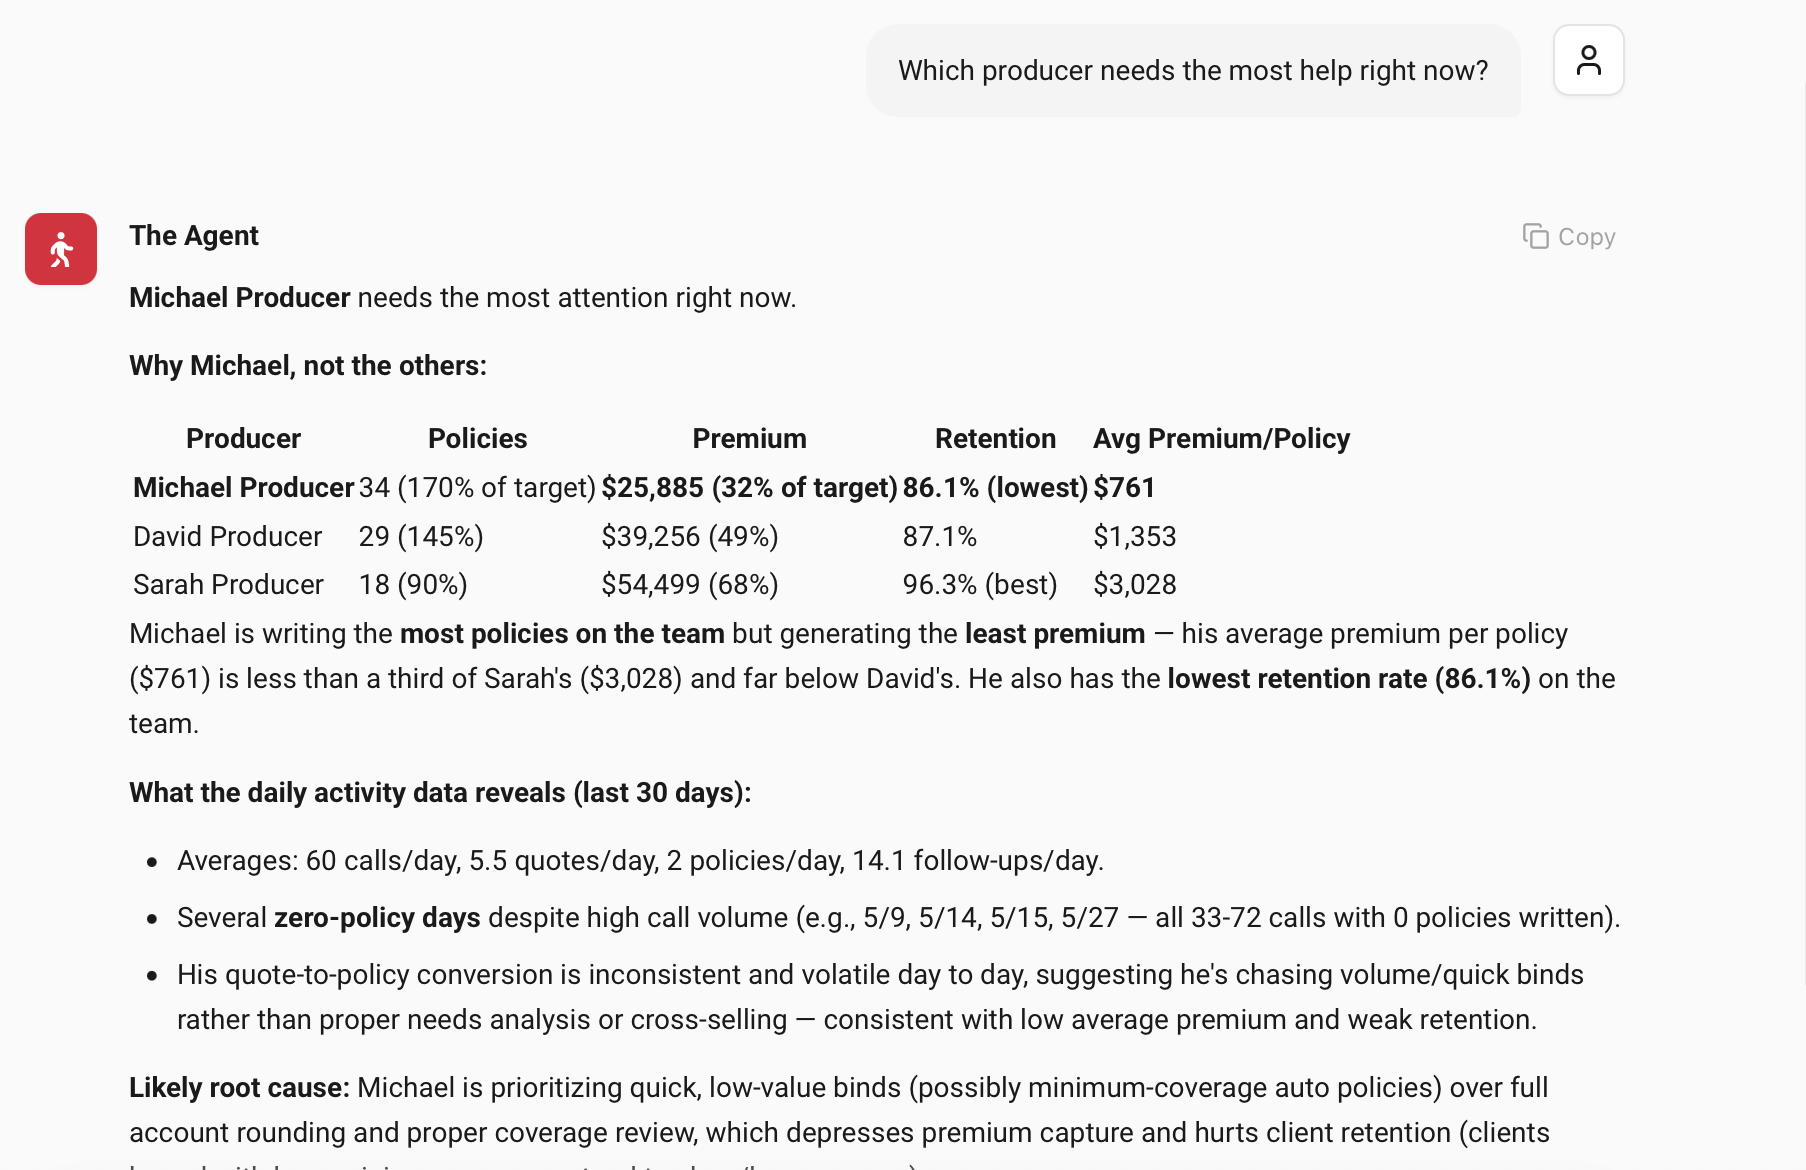
The Agent is your AI Chief of Staff — wired into your live production, activity and commission data. Ask it anything in plain English and it answers from what's actually happening in your agency, and can even log activity or draft goals and plans for your approval.
Starting a chat
Type in the box (Enter sends, Shift+Enter for a new line) or click one of the suggested prompt pills such as “Check last week's activity” or “Set targets.” New Chat starts fresh; the chat history lives in the collapsible left sidebar.
Organizing chats
Use New Folder to group related chats. Hover a chat to move it into a folder or delete it; hover a folder to add a chat inside or remove the folder (its chats are kept). Every assistant message has a Copy button.
What it can see
- Agency KPIs and per-producer stats, plus ~90 days of history.
- Your open deal pipeline and marketing ROI by channel.
- Commission tiers and everything in your Resource Library.
Approvals
When The Agent proposes goals, KPI targets or plan items, it shows them as a card with Approve and Modify buttons — nothing is written to your agency until you approve. It can also render charts inline and offer to save useful analysis to your Resource Library.
A note below the box reminds you: “The Agent can make mistakes. Consider verifying important information.”
Goals & KPIs
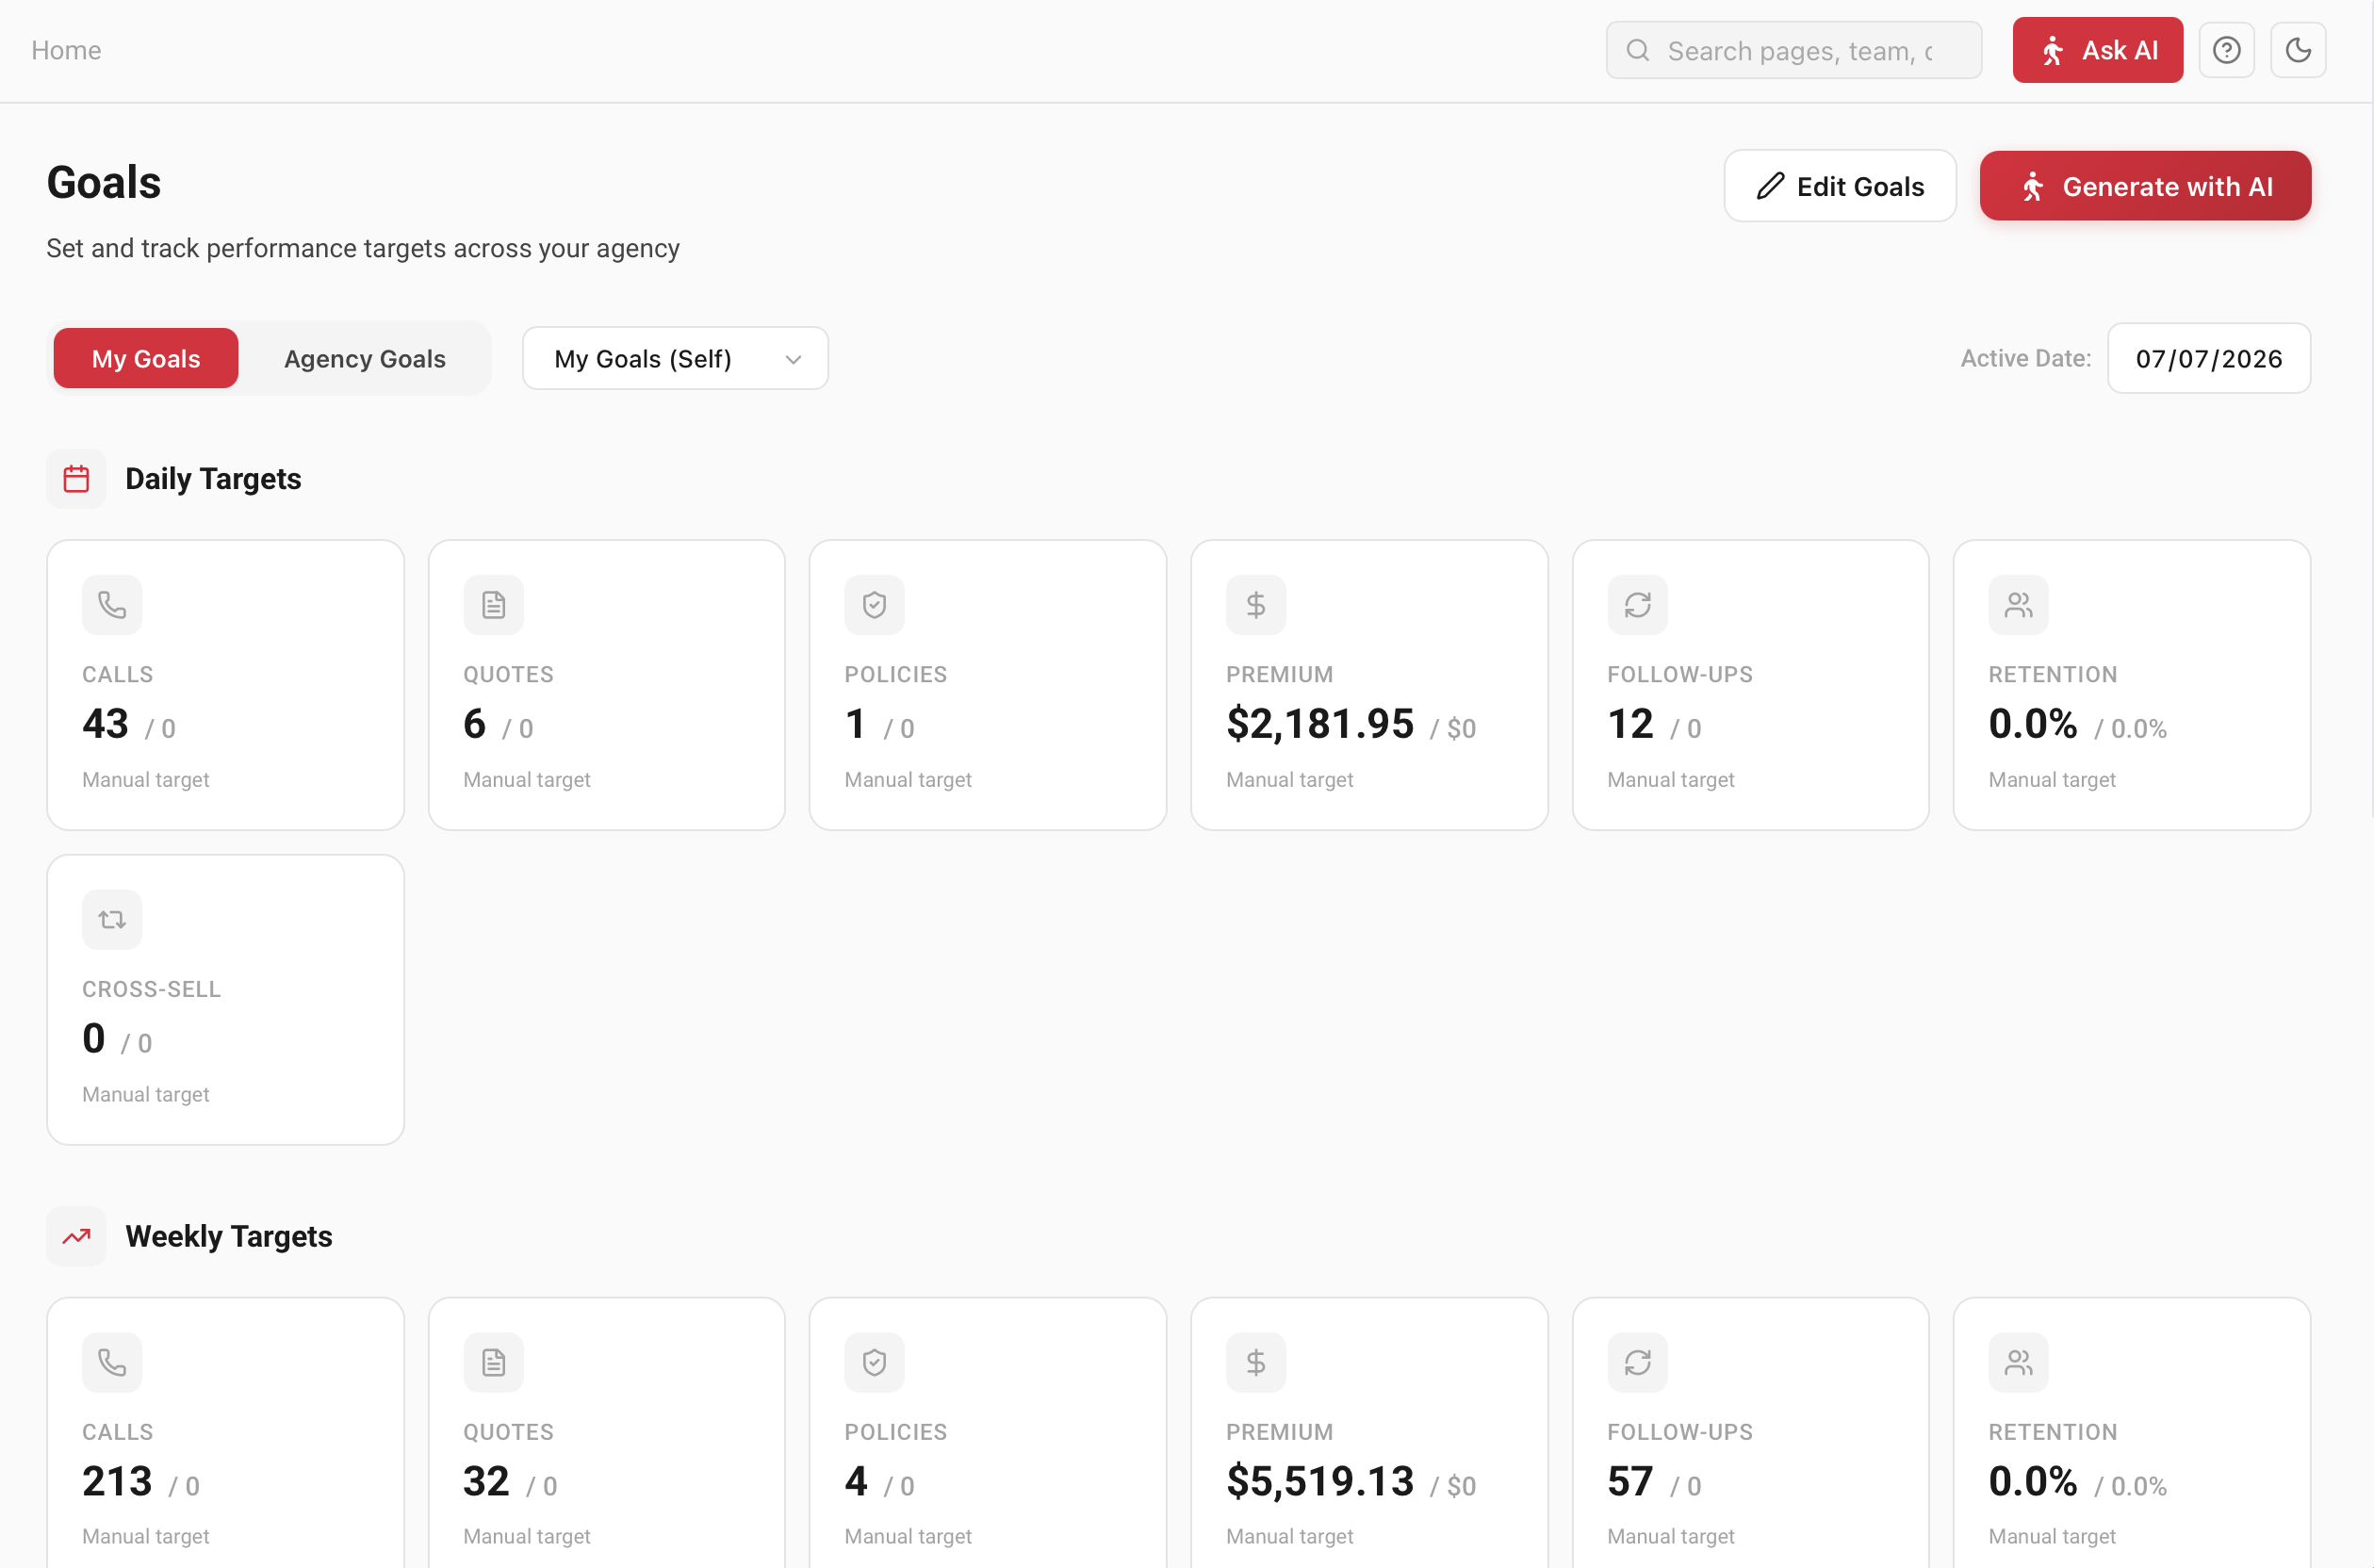
Set daily, weekly and monthly targets for the agency and each producer — by hand or generated by The Agent from real performance history — and track progress against them.
Scope & period
Tabs switch between My Goals and Agency Goals. Managers get a producer dropdown in My Goals to view/edit any team member. The Active Date picker decides which period counts as “current.” Goals are grouped into Daily, Weekly and Monthly sections.
Metrics tracked
Calls, Quotes, Policies, Premium, Follow-ups, Retention and Cross-sell. Each goal card shows the target, a progress bar, and whether it was a Manual target or AI-generated.
Setting goals
| Action | How |
|---|---|
| Edit by hand | Edit Goals → adjust the number inputs → Save Changes (“Goals saved.”). |
| Generate with AI | Generate with AI opens Ask The Agent, which proposes all three cadences for you to approve. |
| Set for everyone | Manager Create for all producers applies one set of goals to the whole team at once. |
Producers can edit their own goals only if the owner has enabled “Producers can edit goals” in Preferences; otherwise their view is read-only. Agency goals are combined totals — edit the individual goals that feed them.
Strategic growth plan
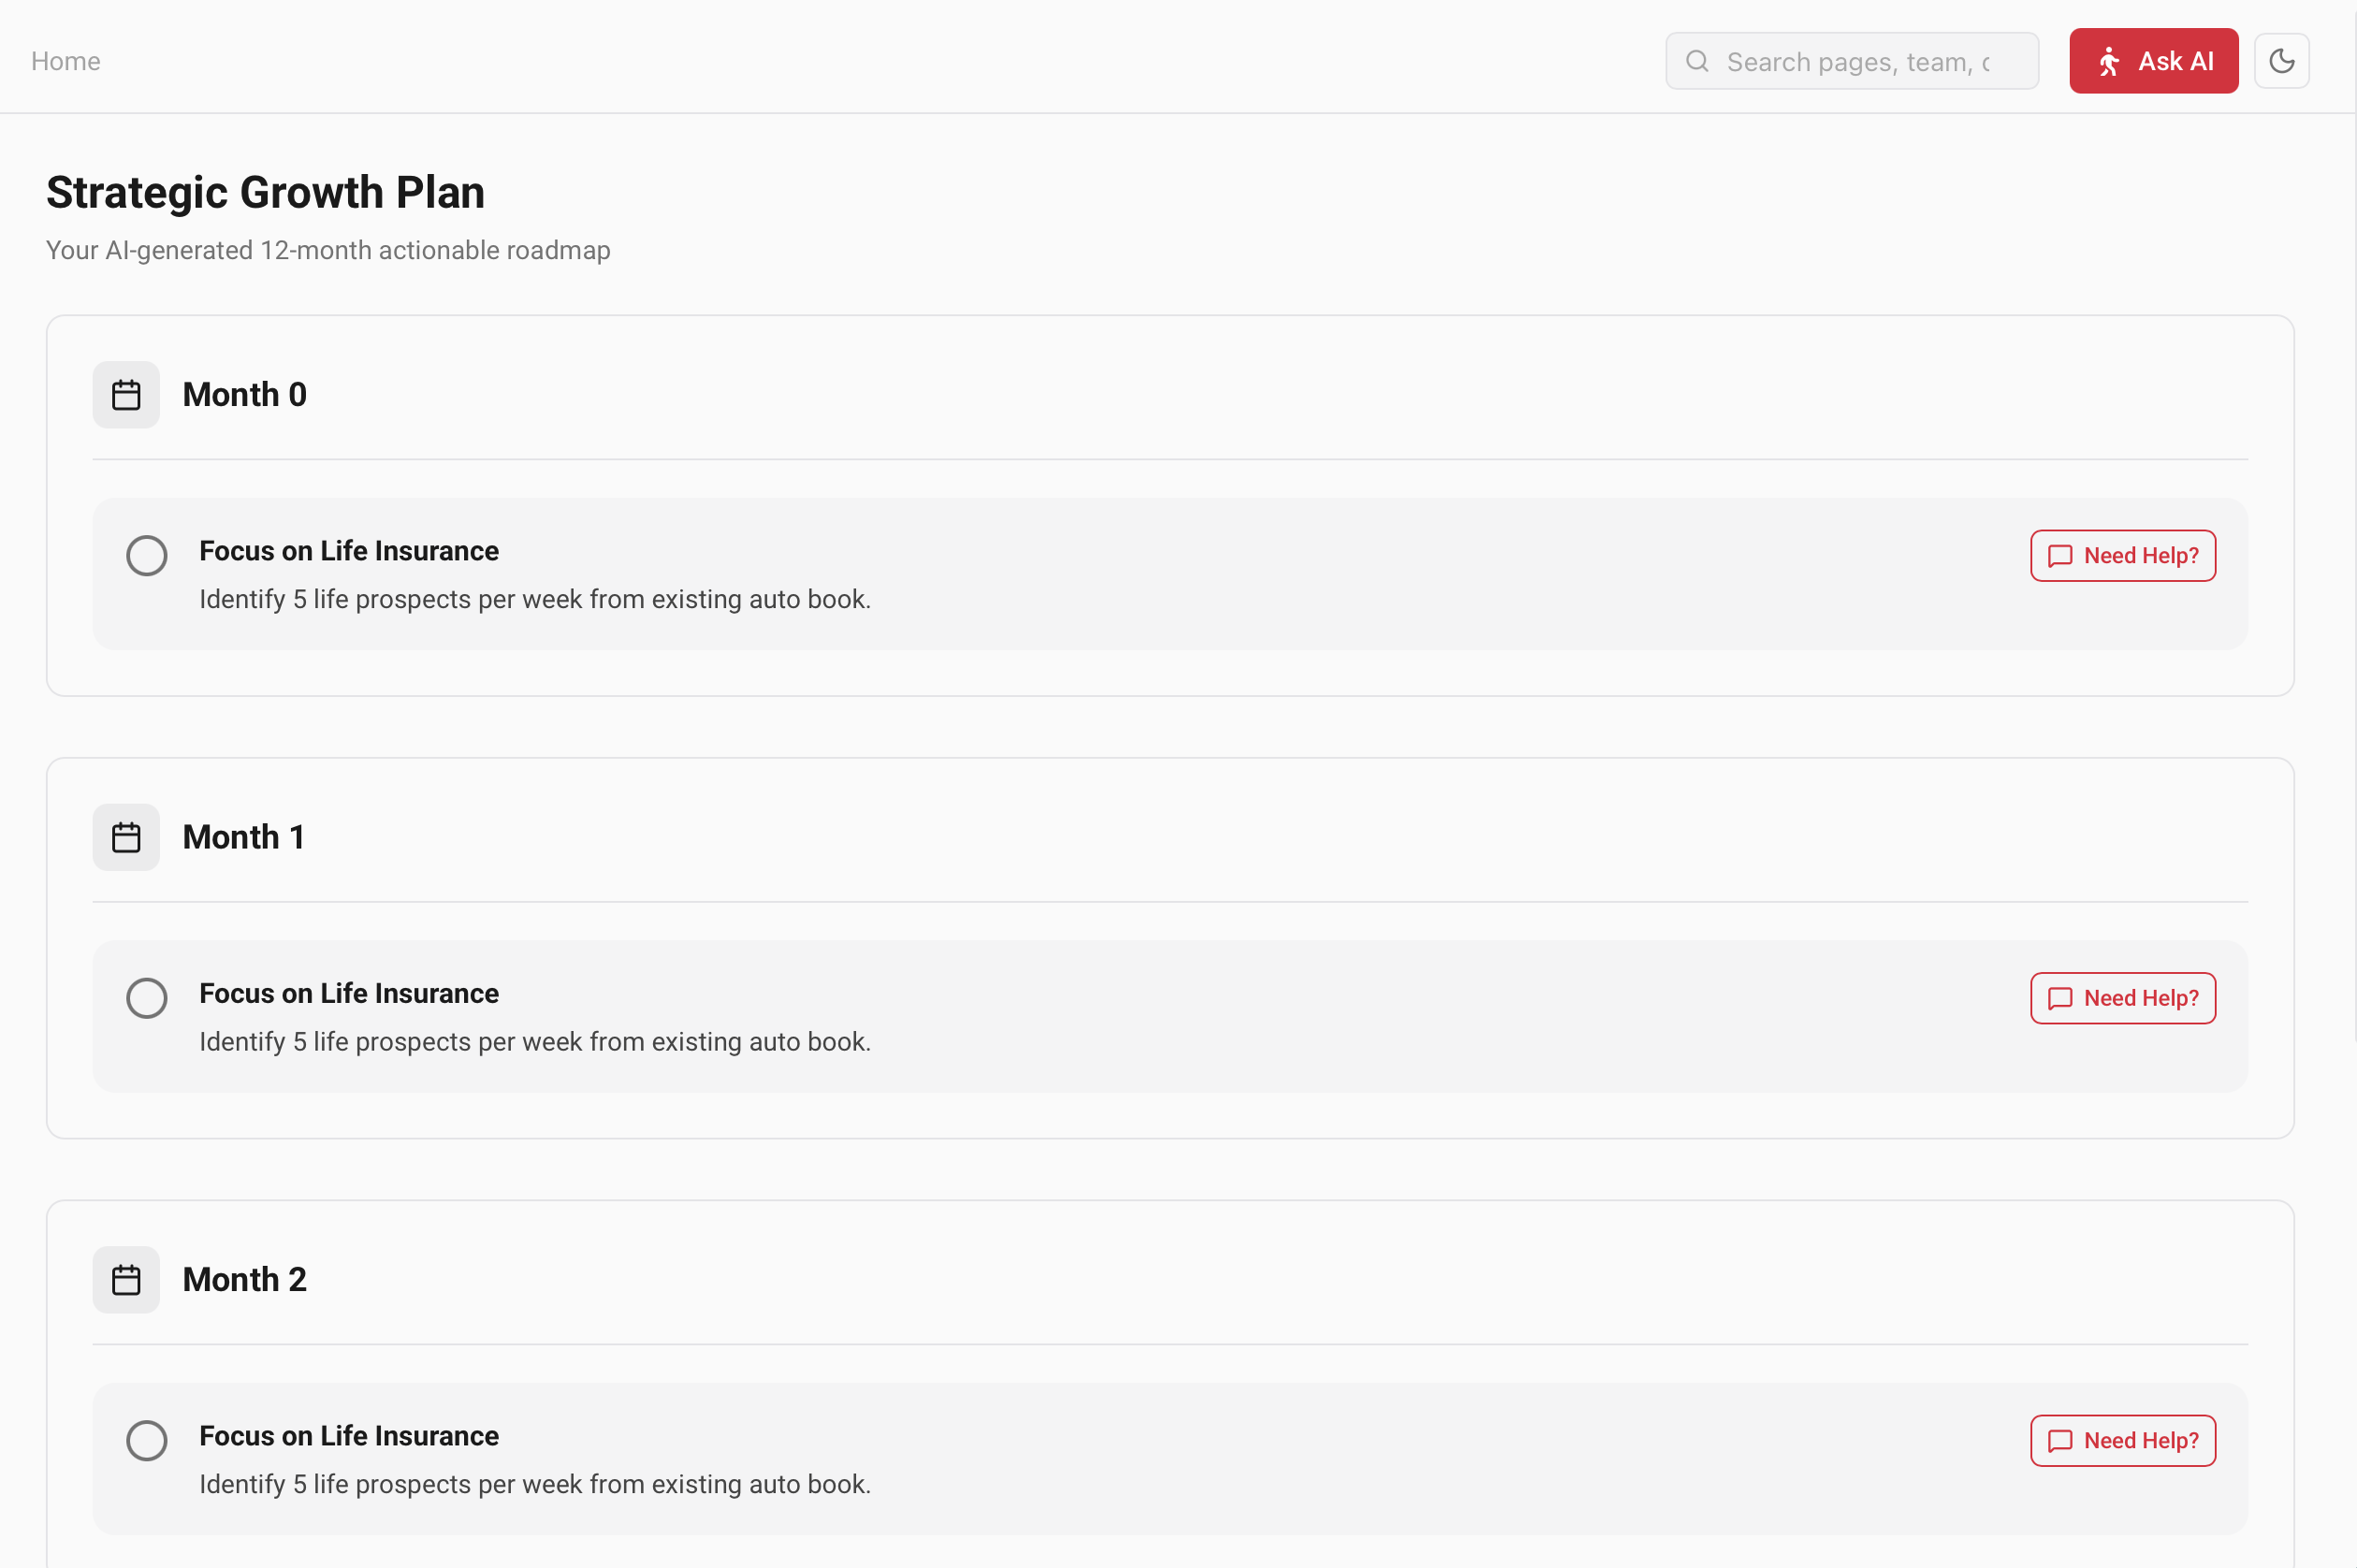
Your 12-month roadmap, generated by The Agent during onboarding and broken into monthly goals with weekly and daily sub-goals you check off as you go.
Progress
A card at the top counts your goals, sub-goals and how many are complete, with an overall percentage and progress bar. Click the circle beside any goal or sub-goal to mark it done.
Working with goals
| Button | What it does |
|---|---|
| Add Goal | Adds a monthly goal — pick a month (1–12), a title and optional description. |
| Break down with AI | Generates weekly and daily sub-goals under a goal. |
| Add sub-goal | Adds a weekly or daily item by hand. |
| Need Help? | Opens Ask The Agent with the goal's context pre-loaded. |
| Edit / Delete | Rename or remove a goal (deleting a goal removes its sub-goals). |
No plan yet? You'll see “No Strategic Plan Found” with options to finish onboarding or add a goal manually.
Word tracks
A shared library of your agency's approved sales scripts and talking points, organized by category and one click to copy.
Finding a script
Search by title or content, or filter by category with the button row (“All” plus each category in use). Each card shows the category, title, a preview, an upvote count and a Copy button.
Creating & editing
- Click New Script.
- Fill Script Title, Category (pick an existing one or type a new one) and Script Content. Use square brackets like
[Name]for placeholders — they render in bold. - Save. Use the small Edit / Delete icons on a card to change it later, and the heart to upvote the ones that work.
Resource library
Your agency's knowledge base — training manuals, scripts and SOPs. Anything you add here also becomes context The Agent can draw on when it answers questions.
Adding a resource
- Click Add Resource.
- Give it a Document Title (e.g. “Outbound Calling Script”) and paste the content into Document Content.
- Save to Knowledge Base. It appears as a card with a preview and the date added.
The more of your playbook lives here, the more specific and on-brand The Agent's coaching and answers become.
Agency calendar
A calendar for follow-ups, quote reviews, cross-sell pivots and annual reviews, with Day, Week, Month and Agenda views.
Views & navigation
Switch between Day, Week, Month and Agenda. Today jumps back to now, and the arrows move by day, week or month. In Agenda view, mark items Done as you complete them.
Scheduling an appointment
Click New Appointment and fill the form:
| Field | Required | Notes |
|---|---|---|
| Title / Client name | Yes | e.g. “Policy Review with John”. |
| Type of event | No | Follow-up, Quote Review, Pivot / Cross-sell, or Annual Review — each color-coded. |
| Date | Yes | — |
| Time | No | Defaults to noon if left blank. |
| Phone / Email | No | Contact details for the appointment. |
| Notes | No | Any prep notes. |
Missing a required field shows “Title and Date are required.”
Import clients
Bring your book of business in from a CSV. The importer auto-matches your columns, previews the data, and reports exactly what was added. Find it under Data → Data Import.
The three steps
- Upload — drop a
.csv(up to 10MB) onto the dropzone, or click to browse. - Map columns — we auto-match your columns to our fields; review and adjust. Fields marked
*are required. A running count shows “N of total rows ready to import.” - Results — “Import Complete!” with counts of imported rows and any errors (with a row-by-row error table). Then View Clients or Import Another.
Fields
| Required | Optional |
|---|---|
| First name, Last name | Email, phone, street, city, state, zip, date of birth, premium amount, policy type, policy number |
Any row missing a first or last name is skipped and counted in the results, so you can fix and re-import just those.
Import History at the bottom lists your last imports with record, success and error counts. Need to bring in a carrier sales export instead? Use Import policy sales.
Import policy sales
Upload a carrier product-sales export and the app detects your producers and product lines, seeds the Sales Ledger, and rolls the totals into your scorecards. Owner / Manager.
The three steps
- Upload — drop a
.xls,.xlsxor.csvexport. The app reads and analyzes it. - Reconcile — review summary cards (policies, written premium, producers, product lines, date range), confirm the column mapping, then decide what happens to each detected producer.
- Results — imported / skipped / error counts, plus any tracked producers created, then View Sales Ledger.
Reconciling producers
For every producer found in the file, pick an action:
| Action | Effect |
|---|---|
| Match / Link | Attach these sales to an existing producer. |
| Create | Create a new tracked producer for them. |
| Skip | Leave them out of the import. |
Two checkboxes let you register the file's product lines and policy types as trackable metrics so they show up across the app. Required columns are product, written by and written premium.
Raw data upload
When you have a file that isn't a clean client or sales CSV — a PDF, an email, a spreadsheet — the Raw Data Upload tool parses it and saves the structured result. Open it from Data Import → Raw Data Upload.
How it works
- Drop a file (PDF, EML, CSV or Excel, up to 10MB) into the modal.
- The tool parses it and shows a JSON Preview of what it extracted.
- Click Save to Database — you'll see “Upload Successful!” when it's stored.
Reach for raw upload for one-off or unusual formats. For your core book, the structured client and policy-sales importers give cleaner results.
Settings overview
Settings is the agency's control panel — profile, KPI targets, team, roles, trackable fields, preferences, compensation, billing and data export. Tabs are shown based on your role.
Tabs at a glance
| Tab | What you configure |
|---|---|
| Agency Profile | Agency name, carrier, and brand color & logo. |
| KPI Targets | Targets for Policies, Premium, Retention and Activity Score. |
| Team & Roles | Add, edit and remove team members; reset passwords. Manager |
| Roles & Permissions | Create custom roles and choose their permissions. Manager |
| Trackable Fields | Define custom activity types. Manager |
| Compensation | Commission and bonus rules — see Compensation. |
| Preferences | App-wide toggles (below). |
| Billing & Subscription | Plan status and the Stripe portal — see Billing. |
| Data Export | Download all agency data. Manager |
Managing the team
On Team & Roles, Add Team Member collects first/last name, email, a starting password (8+ chars), role and optional hire date. Editing a member lets you update their details, base salary (where permitted) and reset their password. Inviting via email sends a setup link that's valid for 24 hours.
Trackable fields
Create custom activity types (e.g. “Referrals”) that appear in the Activity Tracker. Each field has a name, a color, an icon, and a Require note toggle that forces a note when logging it.
Preferences
| Toggle | Effect |
|---|---|
| Show helpful tooltips | Shows or hides inline help throughout the app. |
| Enable notifications | Notification preference. |
| Producers can edit goals | Lets producers set their own goals; off by default. |
| Employee ROI tracking | Turns on the Employees & ROI features; off by default. |
Click Save to apply. Data Export downloads a ZIP with one CSV per table.
Branding & white-label
Use The Agent runs under your agency's name and colors. Branding lives on the Agency Profile tab of Settings, and applies across the whole app.
Logo
Choose Default (the Use The Agent mark), a State Farm preset, or Custom upload. Custom logos accept common image formats up to 150KB — over that you'll see “Image is too large. Please choose one under 150KB.” A live preview shows your choice.
Brand color
Enter a hex value (#RRGGBB) or pick a preset swatch (indigo, State Farm red, blue, green, amber, violet, slate). The color theming updates across the app. Click Save to apply; you'll see a brief “Saved” confirmation.
The same platform can be deployed across many offices, each fully branded — the intelligence stays the same, the identity is yours.
Compensation & commissions
The Compensation tab builds your pay plan — commissions and bonuses — as a set of flexible rules. Producers then see the results on their Scorecard. (The old “Commissions” page simply redirects here.)
Building a rule
Add a rule and give it a name, then choose how it calculates:
| Calculation type | Example |
|---|---|
| % of Premium | 10% of written premium. |
| $ Per Unit | A flat dollar amount per policy. |
| $ at Threshold | A bonus once a milestone is hit (e.g. $500 at 50 policies). |
| Rate Bump | Increase the rate past a threshold (e.g. +2% over $50K premium). |
Rule options
| Setting | Purpose |
|---|---|
| Applies to | All producers or specific ones. |
| Metric source | Premium, policy, retention, activity, or a custom trackable field. |
| Product | Scope the rule to a line of business (e.g. Auto only). |
| Rate / value | The percentage or dollar amount. |
| Threshold type & value | For threshold and rate-bump rules — by policy count or premium. |
| Active | Turn a rule on or off without deleting it. |
Save to apply. Each producer's commission — base, tier bonus and total — then appears on their scorecard's Commission tab, and managers get a producer-by-producer table with an agency total.
Billing & plans
Billing is handled securely through Stripe. Manage your subscription from the Billing & Subscription tab of Settings.
Managing your subscription
- Manage billing opens the Stripe customer portal, where you can update your card, view invoices and change your plan. It returns you to Settings when you're done.
- Agencies on complimentary access see a badge instead of a billing button.
- Premium features (like Sales Forecast and Close Ratios) require a paid plan. Hitting one on a free plan shows an upgrade page with a Manage billing button.
Current plan pricing is on the pricing section of the main site. Promo codes can be applied during signup or in the Stripe portal.
Platform settings
Platform Settings is the system-administrator panel for the whole platform — tenant access, complimentary status and Stripe billing across every agency. System admin only.
Tenant access & billing
A table of every agency (tenant) with its complimentary status, who set it and when, per-tenant feature toggles, and Stripe subscription status (active, trialing, past due, free or none).
Stripe dashboard
When Stripe is configured, this page also surfaces platform-wide billing:
| Section | Shows |
|---|---|
| Overview | Monthly Recurring Revenue, available balance and active subscription count. |
| Plans & Pricing | Active Stripe products with price, interval and features. |
| Active Coupons | Discounts and the customer-facing promo codes tied to them. |
| Recent Failed Charges | The latest failed payments with amount, email and reason. |
This page is invisible to normal agency accounts. Agency owners manage their own plan under Billing & plans.